The short answer: across 50 years of data, gold’s strongest seasonal window runs from early October to late February — in modern bull-market years this “winter rally” has averaged +7.9%. Among calendar months, January averages +1.8% (up 62% of years) and November +1.4%. As of October 28, 2026, gold is grinding a bottom near $4,050 — 27.8% below its January peak of $5,602 — right as the seasonal tailwind window opens.
Tonight’s FOMC decision (2 a.m. Thursday Beijing time) adds a catalyst: CME FedWatch prices a 92.8% chance of a hold, while a 25bp December hike sits at 77.7%. A “quiet now, tighter later” rate path landing exactly on the seasonal turn is the best real-world test this 50-year-old pattern could ask for.
What Gold Seasonality Actually Is
Seasonality is the statistical tendency of an asset to behave similarly at the same point in the calendar year. It isn’t mysticism — it’s the mechanical repetition of physical demand, portfolio rebalancing, and liquidity cycles: Diwali and Indian wedding season, Chinese New Year restocking, Western Christmas consumption, and year-end institutional rebalancing all happen on roughly the same dates every year.
For a quant trader, seasonality is not a standalone signal. It’s a win-rate modifier — the same technical setup can carry a 10-plus percentage point difference in historical win rate depending on whether it fires inside a strong or weak seasonal window.
The 50-Year Data: Gold’s Monthly Win-Rate Map
Aggregating independent studies of London gold monthly returns from 1974 to 2024, here is the full calendar breakdown:
| Month | 50-Year Avg Return | % of Up Years | Primary Driver |
|---|---|---|---|
| January | +1.8% | 62% | Chinese New Year restocking, fresh-year allocation flows |
| February | +0.4% | 52% | Post-holiday consolidation |
| March | -0.6% | 46% | Weakest month; tax-related selling |
| April | -0.3% | 48% | Q1 position squaring |
| May | +0.5% | 54% | Indian wedding season |
| June | -0.4% | 46% | Summer doldrums begin |
| July | +0.3% | 50% | Low-volume chop |
| August | +1.2% | 58% | Pre-festival restocking starts |
| September | +2.1% | 64% | Strongest on 50-year average (Indian festival peak) |
| October | +0.8% | 57% | Diwali physical demand |
| November | +1.4% | 60% | Indian weddings + Western year-end consumption |
| December | +1.5% | 62% | Christmas demand + seasonal dollar softness |
One nuance worth respecting: conclusions shift with the sample window. On 2005-present data, September is actually a weak month (September 2025’s +11.03% was an exception), while January and December stay strong in every window. When trading seasonality, weight the months that are consistent across multiple sample periods.
The Real Edge: The October-to-February Winter Rally
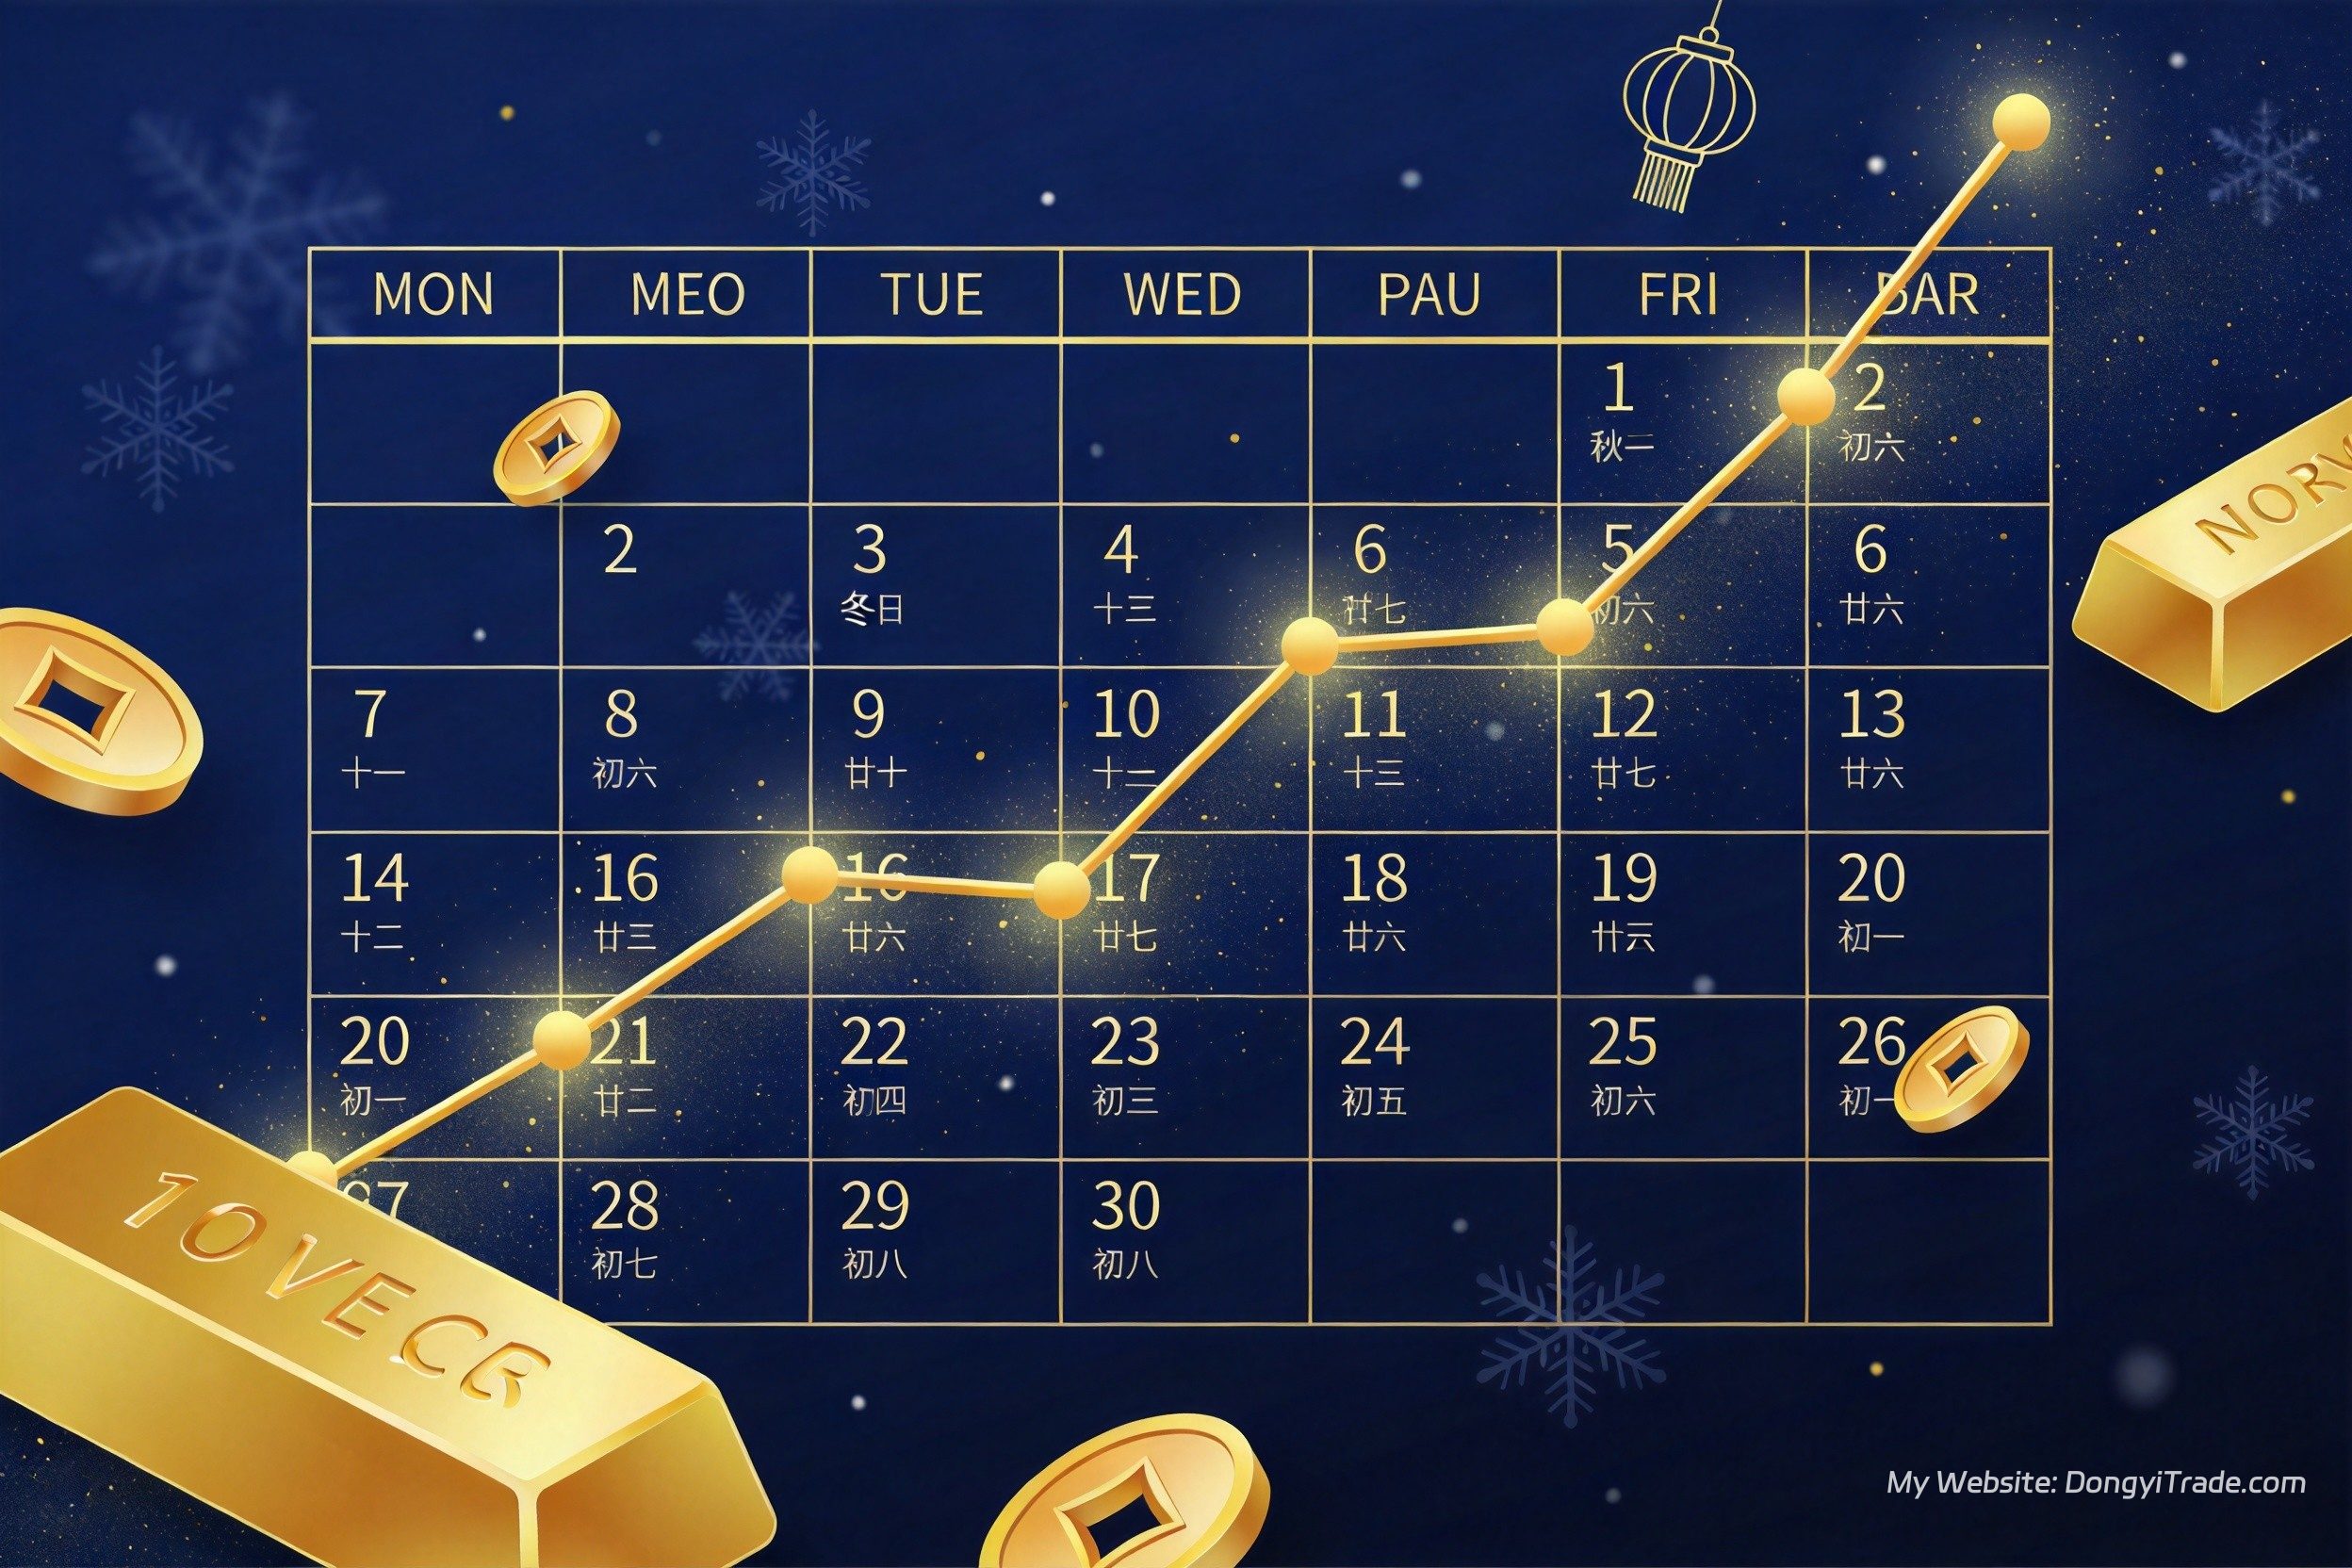
Single-month stats are the surface. The most tradable finding in seasonal research is the multi-month window. Across the 22 modern bull years (2001-2012 and 2016-2025), gold’s winter rally — from the early-October low into late February — has averaged +7.9%, the longest and strongest seasonal stretch of the year. January (+2.8%) and November (+2.0%) are the two strongest calendar months inside it.
The physical side is confirming the calendar: the World Gold Council’s October 20, 2026 India update notes seasonal demand arriving early despite elevated prices, with domestic price discounts narrowing. Physical buyers are returning on schedule.
The 2026 Scoreboard: When Seasonality Fails
Mapping this year’s actual monthly returns against seasonal expectations keeps you honest about how to use the pattern:
| Month | 2026 Actual | Seasonal Expectation | Delivered? |
|---|---|---|---|
| January | +13.25% | Strong | Yes — massively exceeded |
| February | +7.83% | Flat | Yes — beat expectations |
| March | -11.57% | Weak | Yes — right direction, extreme size |
| June | -11.18% | Weak | Yes — right direction |
| August | +9.99% | Strong | Yes |
| September | -6.57% | Strong (weak on recent-20yr) | No — failed |
| October (through 27th) | -4.15% | Mildly strong | Not yet |
The takeaway: direction matched seasonality for most of the first eight months of 2026, then September and October broke the pattern — because macro forces (the Fed’s first hike in three years this September, inflation re-accelerating to 3.7%) outweighed the calendar. That’s exactly how seasonality should be treated: a backdrop, not a trigger.
Three Executable Seasonal Playbooks
Playbook 1: Trend-Following Longs Only in the Strong Window
From early November through late February, take only long-side trend signals (bullish MA alignment, breakout-retest entries). In weak months (March, June), down-weight or skip long signals entirely. Encoding the calendar into your strategy filter is the cheapest win-rate improvement available.
Playbook 2: Don’t Chase Shorts in Weak Months, Don’t Chase Longs in Strong Ones
Seasonality’s biggest practical value is as a constraint. A March drop is “normal,” so chasing shorts there means walking into April’s mean reversion. A November rally is “normal,” but chasing longs after a 5% monthly gain dilutes your win rate badly. In strong windows, buy the dips; in weak windows, sell the rallies.
Playbook 3: Only Fire When Seasonality Meets Technicals
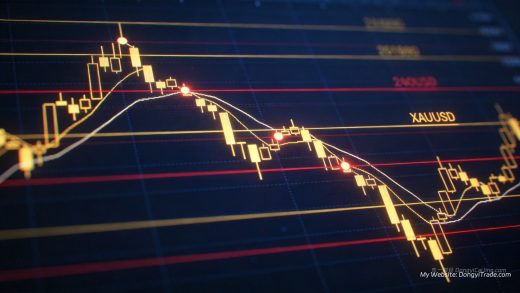
The current chart is a textbook case. Gold has defended the $3,975-$4,000 zone twice (October 21 and 27), landing precisely on the late-October seasonal turn. If tonight’s FOMC delivers the expected hold, you get the standard winter-rally entry structure: macro not interfering + seasonal window opening + key support confirmed. First target is the October 20 high near $4,130; stops belong below the $3,975 double bottom.
FAQ
Which month is historically best for gold?
On the 50-year average, September is strongest (+2.1%, up 64% of years). But on recent-20-year data, January is the most reliable (averaging +1.8% or more, with 62-80% win rates across studies) — and January stays strong in every sample window, making it the highest-conviction seasonal month.
Is gold seasonality still working in 2026?
Direction matched the calendar for most of the first eight months (strong January/February/August, weak March/June), then September and October failed under the pressure of the Fed’s hiking cycle. Seasonality is a probability modifier — when macro events carry more weight, the calendar steps aside.
Why is November through February gold’s traditional strong season?
Four overlapping forces: Indian Diwali and wedding-season physical demand, Chinese New Year jewelry restocking, Western Christmas consumption, and the dollar’s seasonal year-end softness. Demand-side and FX-side tailwinds peak in the same stretch — which is why modern bull years averaged +7.9% from early October to late February.
Can I trade gold on seasonality alone?
No. Seasonality tells you which months favor longs or shorts — it gives no entry point and no stop level. The correct use is as a filter layered on top of technical levels and risk management, never as a signal source by itself.
To pair technical patterns with seasonal windows, read Gold Chart Patterns Ranked by Win Rate: 10 Years of XAUUSD Data. For the Q4 price map and rate-path scenarios, see Gold Market Outlook October 2026. For the trend-filter parameters, check SMA vs EMA in Gold Trading.
About the author: Dongyi Guo, professional quantitative trader focused on XAUUSD gold strategy research and live trading, running Dongyi Finance (dongyitrade.com) to share quant strategies and in-depth market analysis.
Contact: Telegram: @DongyiTrade