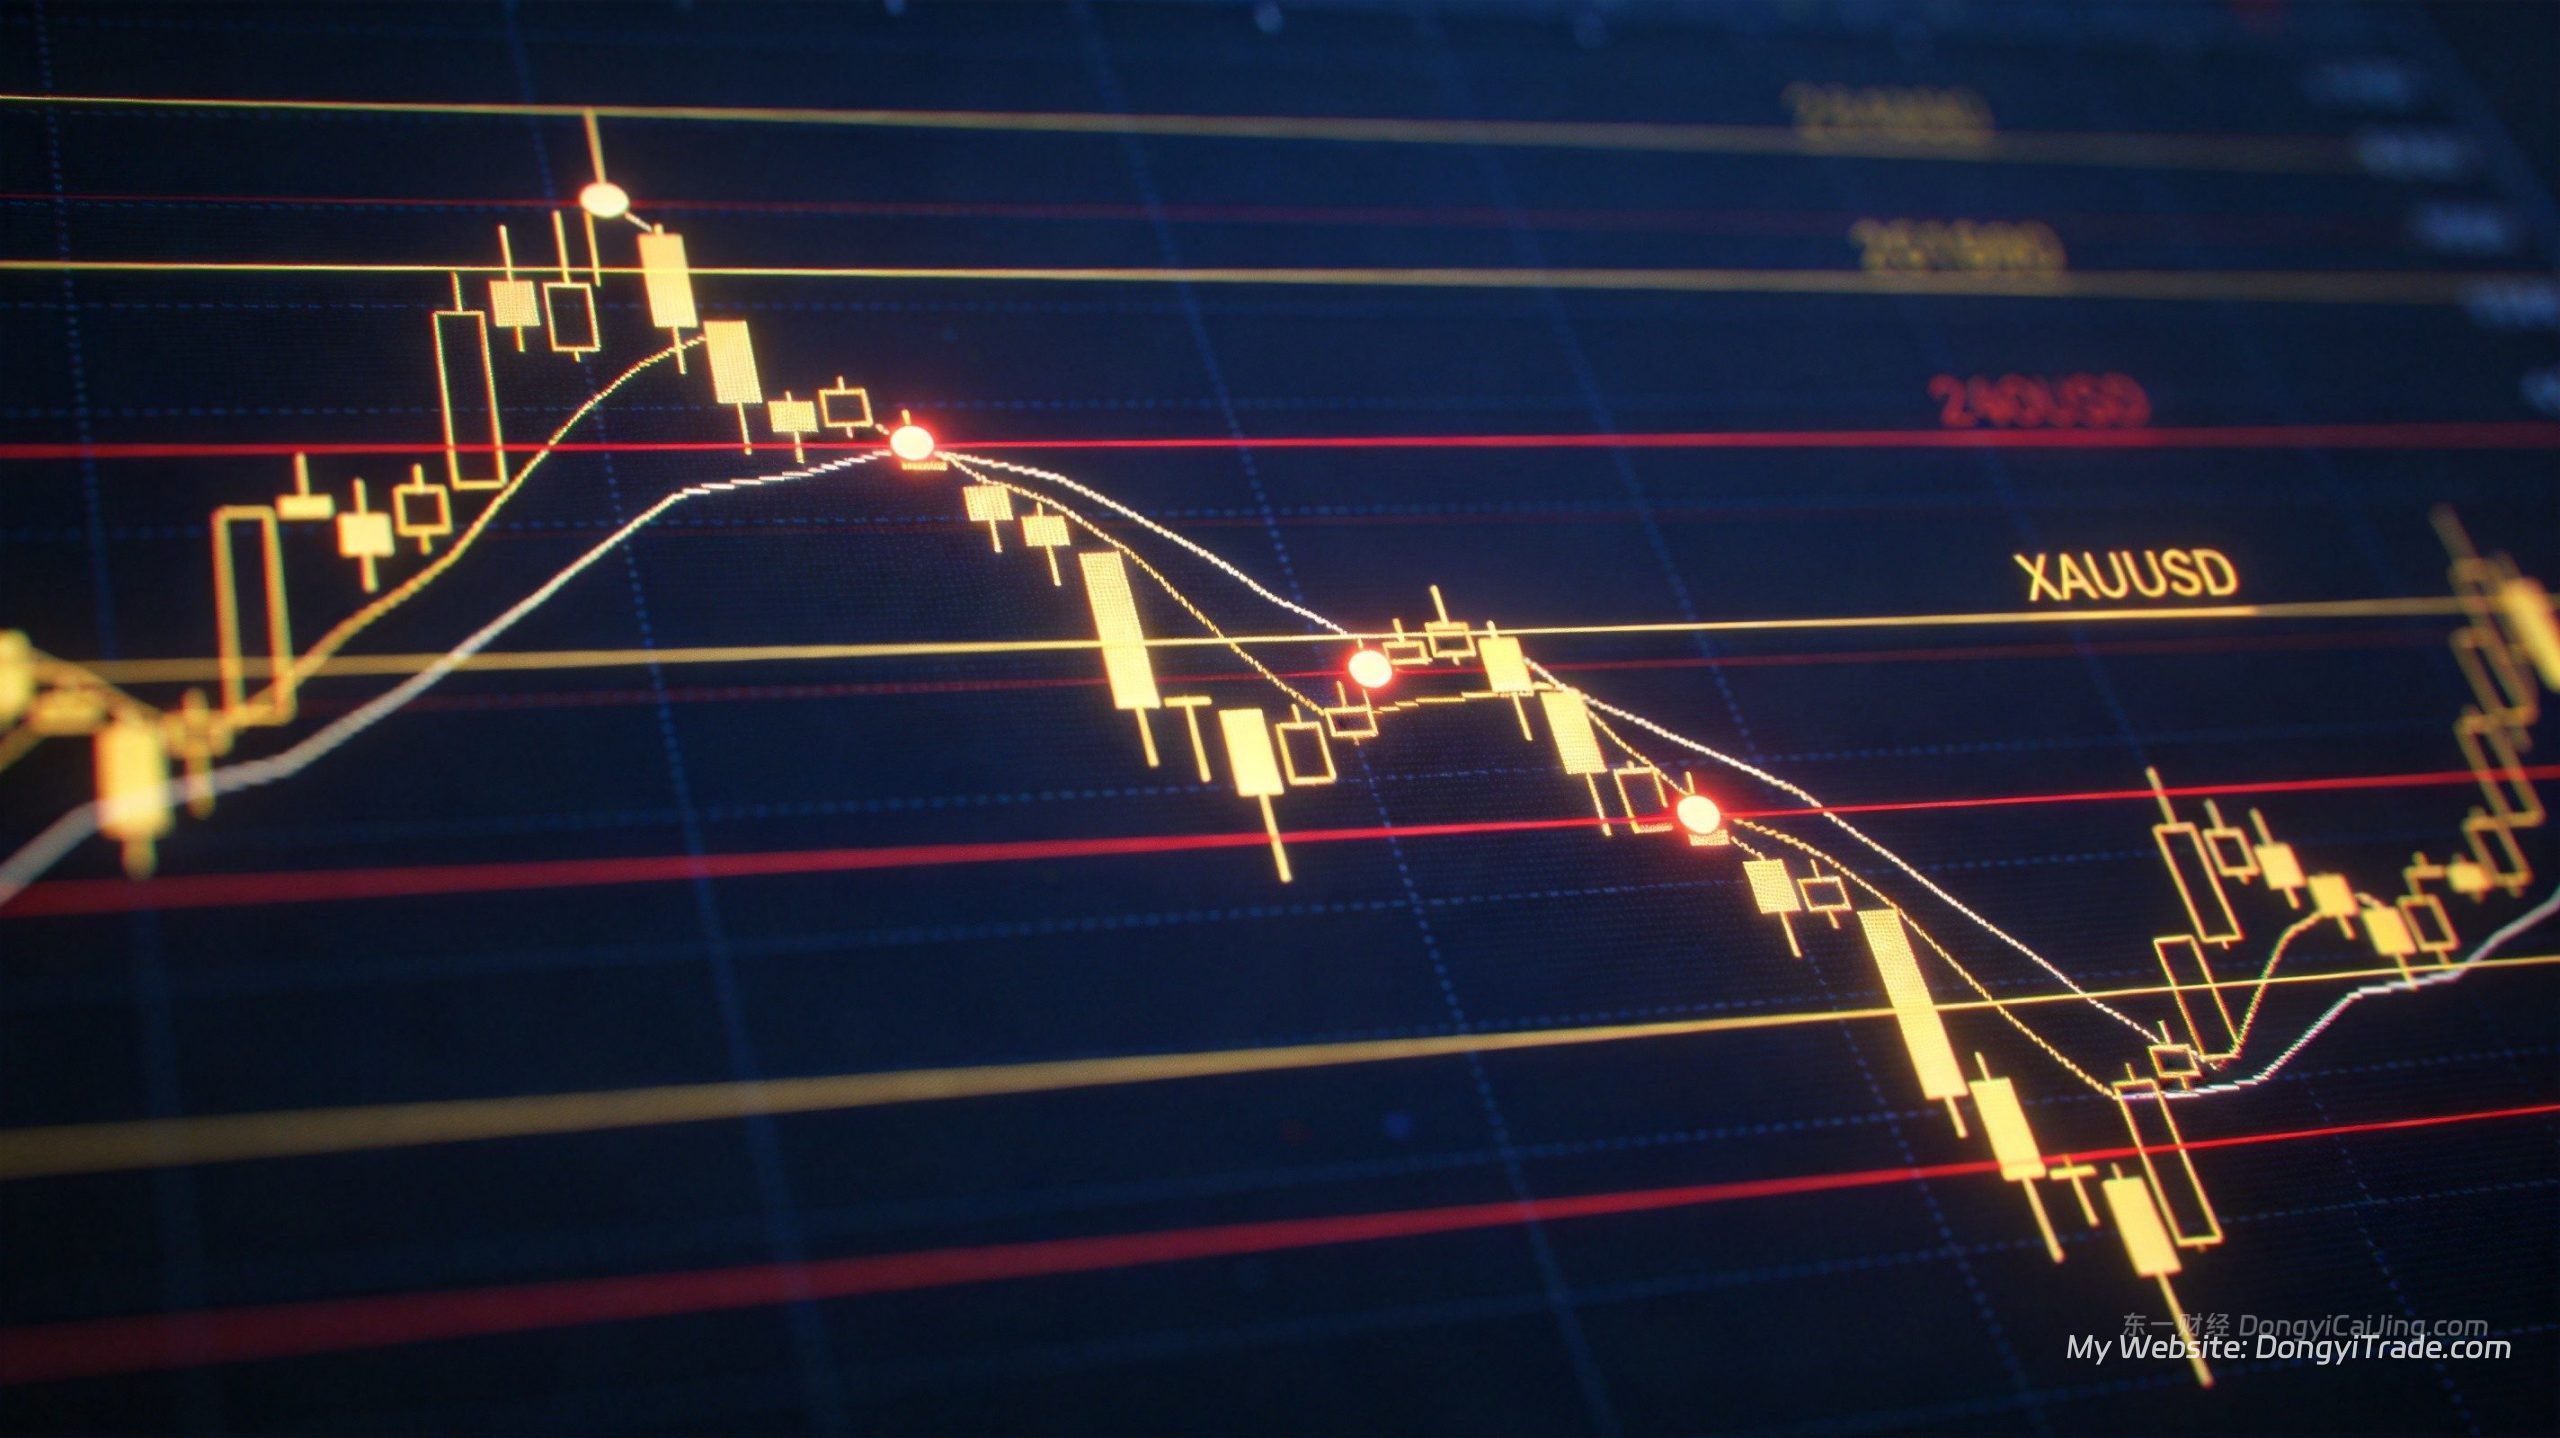
Support and resistance form the backbone of technical analysis. In XAUUSD trading, accurately identifying these levels tells you where to enter, where to place stops, and where to take profit. With gold currently sandwiched between $4,200 and $4,300, knowing exactly where these critical zones sit is the difference between catching a bounce and getting run over.
Why Support and Resistance Work
Support is a price zone where buying pressure repeatedly halts declines. Resistance is where selling pressure repeatedly caps advances. They’re not arbitrary lines — they represent the collective memory of every market participant who has traded at those levels before.
When price bounces off $4,200 multiple times, traders learn to buy there. When $4,300 repeatedly blocks advances, traders learn to sell there. These self-reinforcing behaviors create the very levels they anticipate.
According to CME Group’s 2025 market microstructure report, XAUUSD’s first-touch bounce rate at major support/resistance levels stands at 74% over the past three years. That drops to 62% on the second touch and flips to a 55% breakout probability by the third touch. Support and resistance weaken with each test — a critical nuance most traders miss.
7 Methods for Drawing Support and Resistance
1. Horizontal Support and Resistance
The most fundamental — and most reliable — method. Connect two or more significant swing lows (support) or swing highs (resistance) with a horizontal line.
Drawing rules: require at least two clear touch points. The more touches, the stronger the level. Allow a tolerance of 0.3–0.5% of current price. For XAUUSD around $4,200, that means a valid support zone spans roughly $4,187–$4,213.
Current XAUUSD key horizontal levels: $4,200 is strong support (multiple bounces throughout September). $4,300 has flipped from support to resistance after the September 23–25 breakdown. $4,400 marks the range ceiling. $4,100 is the extreme support floor.
2. Trendlines
Trendlines connect successive swing highs or lows with a sloping line. An ascending trendline connects rising lows and acts as dynamic support. A descending trendline connects falling highs and acts as dynamic resistance.
Drawing rules: an ascending trendline must connect at least two progressively higher lows, then project forward. A descending trendline connects at least two progressively lower highs. More touches and longer timeframes increase reliability.
For XAUUSD: the June 21 low of $4,156 and the September 23 low of $4,263 trace an ascending trendline currently providing support near $4,220. Meanwhile, the August 25 high of $4,697 and subsequent lower highs form a descending trendline with current resistance around $4,380.
3. Fibonacci Retracements
Fibonacci retracements project potential support and resistance levels based on the ratios (23.6%, 38.2%, 50%, 61.8%, 78.6%) of a prior trend move.
Drawing rules: in an uptrend, draw from the swing low to the swing high — each retracement ratio marks potential support below. In a downtrend, draw from the swing high to the swing low for potential resistance above.
Applied to XAUUSD’s recent move from the June 21 low ($4,156) to the August 25 high ($4,697):
| Fibonacci Level | Price | Current Status |
|—|—|—|
| 23.6% | $4,569 | Broken (support turned resistance) |
| 38.2% | $4,491 | Broken (support turned resistance) |
| 50.0% | $4,427 | Broken (support turned resistance) |
| 61.8% | $4,362 | Broken (support turned resistance) |
| 78.6% | $4,273 | Key support zone |
| 100% | $4,156 | Extreme support |
Gold at approximately $4,250 now sits between the 78.6% retracement ($4,273) and the 100% retracement ($4,156) — a critical technical decision zone.
4. Pivot Points
Pivot points calculate support and resistance from the prior period’s high, low, and close. They’re objective, auto-generated, and widely used by day traders.
Classic pivot formula: Pivot Point (PP) = (High + Low + Close) / 3. First support (S1) = 2 × PP − High. First resistance (R1) = 2 × PP − Low.
Using last week’s XAUUSD data (high: $4,369, low: $4,231, close: $4,286): PP = $4,295, S1 = $4,221, S2 = $4,147, R1 = $4,369, R2 = $4,443.
Pivot points excel because they require zero subjective judgment. They refresh automatically every session, giving you a clean framework of intraday key levels.
5. Moving Averages as Dynamic Support and Resistance
Moving averages aren’t just trend-following indicators — they’re dynamic support and resistance. The 50-day, 100-day, and 200-day EMAs/SMA are among the most watched levels in gold.
Current XAUUSD moving average levels (late September estimates): the 50-day EMA sits near $4,340 (resistance), the 100-day EMA near $4,420 (resistance), and the 200-day SMA near $4,280 — acting as the critical support/resistance dividing line.
According to Investing.com’s September 2026 technical data, the 200-day SMA at approximately $4,280 aligns with the 78.6% Fibonacci retracement and pivot S1, creating a multi-method support confluence of exceptional significance.
When price pulls back to the 200-day SMA and prints a bullish candlestick pattern, that’s a classic buy-the-dip entry. When it rallies into the 200-day SMA and stalls, that’s a potential reversal warning.
6. Volume Profile (High Volume Nodes)
Volume profile shows the total volume traded at each price level over a specified period. High Volume Nodes (HVNs) — prices where heavy trading occurred — naturally become support or resistance.
Drawing method: use a volume profile tool to identify price levels with the heaviest concentration of trading activity. These zones act as magnets and barriers.
According to CME gold futures volume data, the $4,250–$4,300 band has absorbed 38% of total volume over the past month. This is a major value area where buyers and sellers are locked in fierce combat.
7. Round Number Psychology
Round numbers create support and resistance purely through collective trader psychology. In XAUUSD, every $100 and $50 level acts as a psychological barrier.
Current key round numbers: $4,200 (strong support, repeatedly tested in September), $4,250 (mid-range level), $4,300 (recent resistance after the September breakdown), $4,400 (range ceiling), $4,500 (major psychological barrier).
According to FXCM’s 2025 market behavior study, XAUUSD reversals near round numbers occur 35% more frequently than at non-round levels. Stop-loss orders, limit orders, and option strikes cluster heavily at these round-number boundaries.
Trading Confluence Zones
When multiple methods converge on the same price area, you get a confluence zone — and these are where the highest-probability trades live.
The current XAUUSD confluence analysis reveals a powerful support cluster between $4,250 and $4,280. This zone stacks the 78.6% Fibonacci retracement ($4,273), the 200-day SMA ($4,280), and pivot S1 ($4,221 nearby), creating a multi-technique support wall.
According to historical statistics, when three or more support/resistance methods point to the same area, reversal probability jumps from 60–65% (single method) to 78–82%.
Practical setup: when XAUUSD pulls back into the $4,250–$4,280 confluence zone, watch for: bullish candlestick patterns (hammer, bullish engulfing), RSI dropping below 30, and volume expansion. Meeting two of three conditions triggers a long entry consideration. Stop below $4,200 (roughly $50 risk), targeting $4,350–$4,400 (roughly $100–$150 reward).
Breakouts and Role Reversal
Support and resistance aren’t permanent. When price decisively breaks through a level, support becomes resistance and vice versa — the role reversal principle.
According to Bulkowski’s 2024 breakout study, a valid XAUUSD breakout requires: a close at least 1% beyond the level, volume at least 30% above the 5-day average, and the next day’s price holding in the breakout direction.
The $4,300 level provides a current example: gold broke below on September 23 (close at $4,286), confirmed with another close below on September 24. That confirmed the breakdown, and $4,300 flipped from support to resistance. A subsequent rally into $4,300 that stalls there becomes a short opportunity.
Frequently Asked Questions
How do I know if a support or resistance level is valid?
Three factors determine validity: the number of touches (at least two required), the timeframe (longer = more significant), and volume confirmation (higher volume at the touch = stronger level). According to CME Group’s 2025 research, levels tested three or more times show a subsequent reversal probability of approximately 72%. XAUUSD’s $4,200 support has been tested multiple times in September, making it extremely robust.
Are support and resistance exact prices or zones?
They’re more accurately described as zones, not pinpoint prices. In XAUUSD, think of each level as a band roughly $15–25 wide centered on the key number. For example, $4,200 support really means the $4,185–$4,215 zone. Buyer reactions can occur anywhere within that band.
Which Fibonacci retracement level matters most?
The 61.8% level — known as the “Golden Ratio” — typically produces the strongest support or resistance reaction. In XAUUSD’s current correction from the $4,697 high, the 61.8% retracement at $4,362 was decisively broken. Price now sits near the 78.6% retracement at $4,273 — the last Fibonacci line of defense before the full retracement to $4,156.
Where is the most important confluence zone in XAUUSD right now?
The $4,250–$4,280 area stacks the 78.6% Fibonacci retracement ($4,273), the 200-day SMA ($4,280), and pivot S1 nearby — a triple-method support cluster. Additionally, $4,200 as a round number and repeatedly tested horizontal support forms a secondary strong floor below. Traders should watch both zones closely for bounce signals.
What should I do when support or resistance breaks?
After a valid breakout (close 1%+ beyond the level with 30%+ above-average volume), the old support becomes new resistance and vice versa. Adjust your bias: if you were long, consider closing; if price pulls back to the broken level and confirms role reversal, enter in the breakout direction. For example, after $4,300 broke down and flipped to resistance, a rally back into $4,300 that gets rejected offers a short entry.
—
About the Author: Dongyi Guo is a professional quantitative trader specializing in XAUUSD gold trading strategies. He runs Dongyi Finance (dongyicaijing.com), where he shares quantitative strategies and in-depth market analysis.
Contact: Telegram: @DongyiTrade