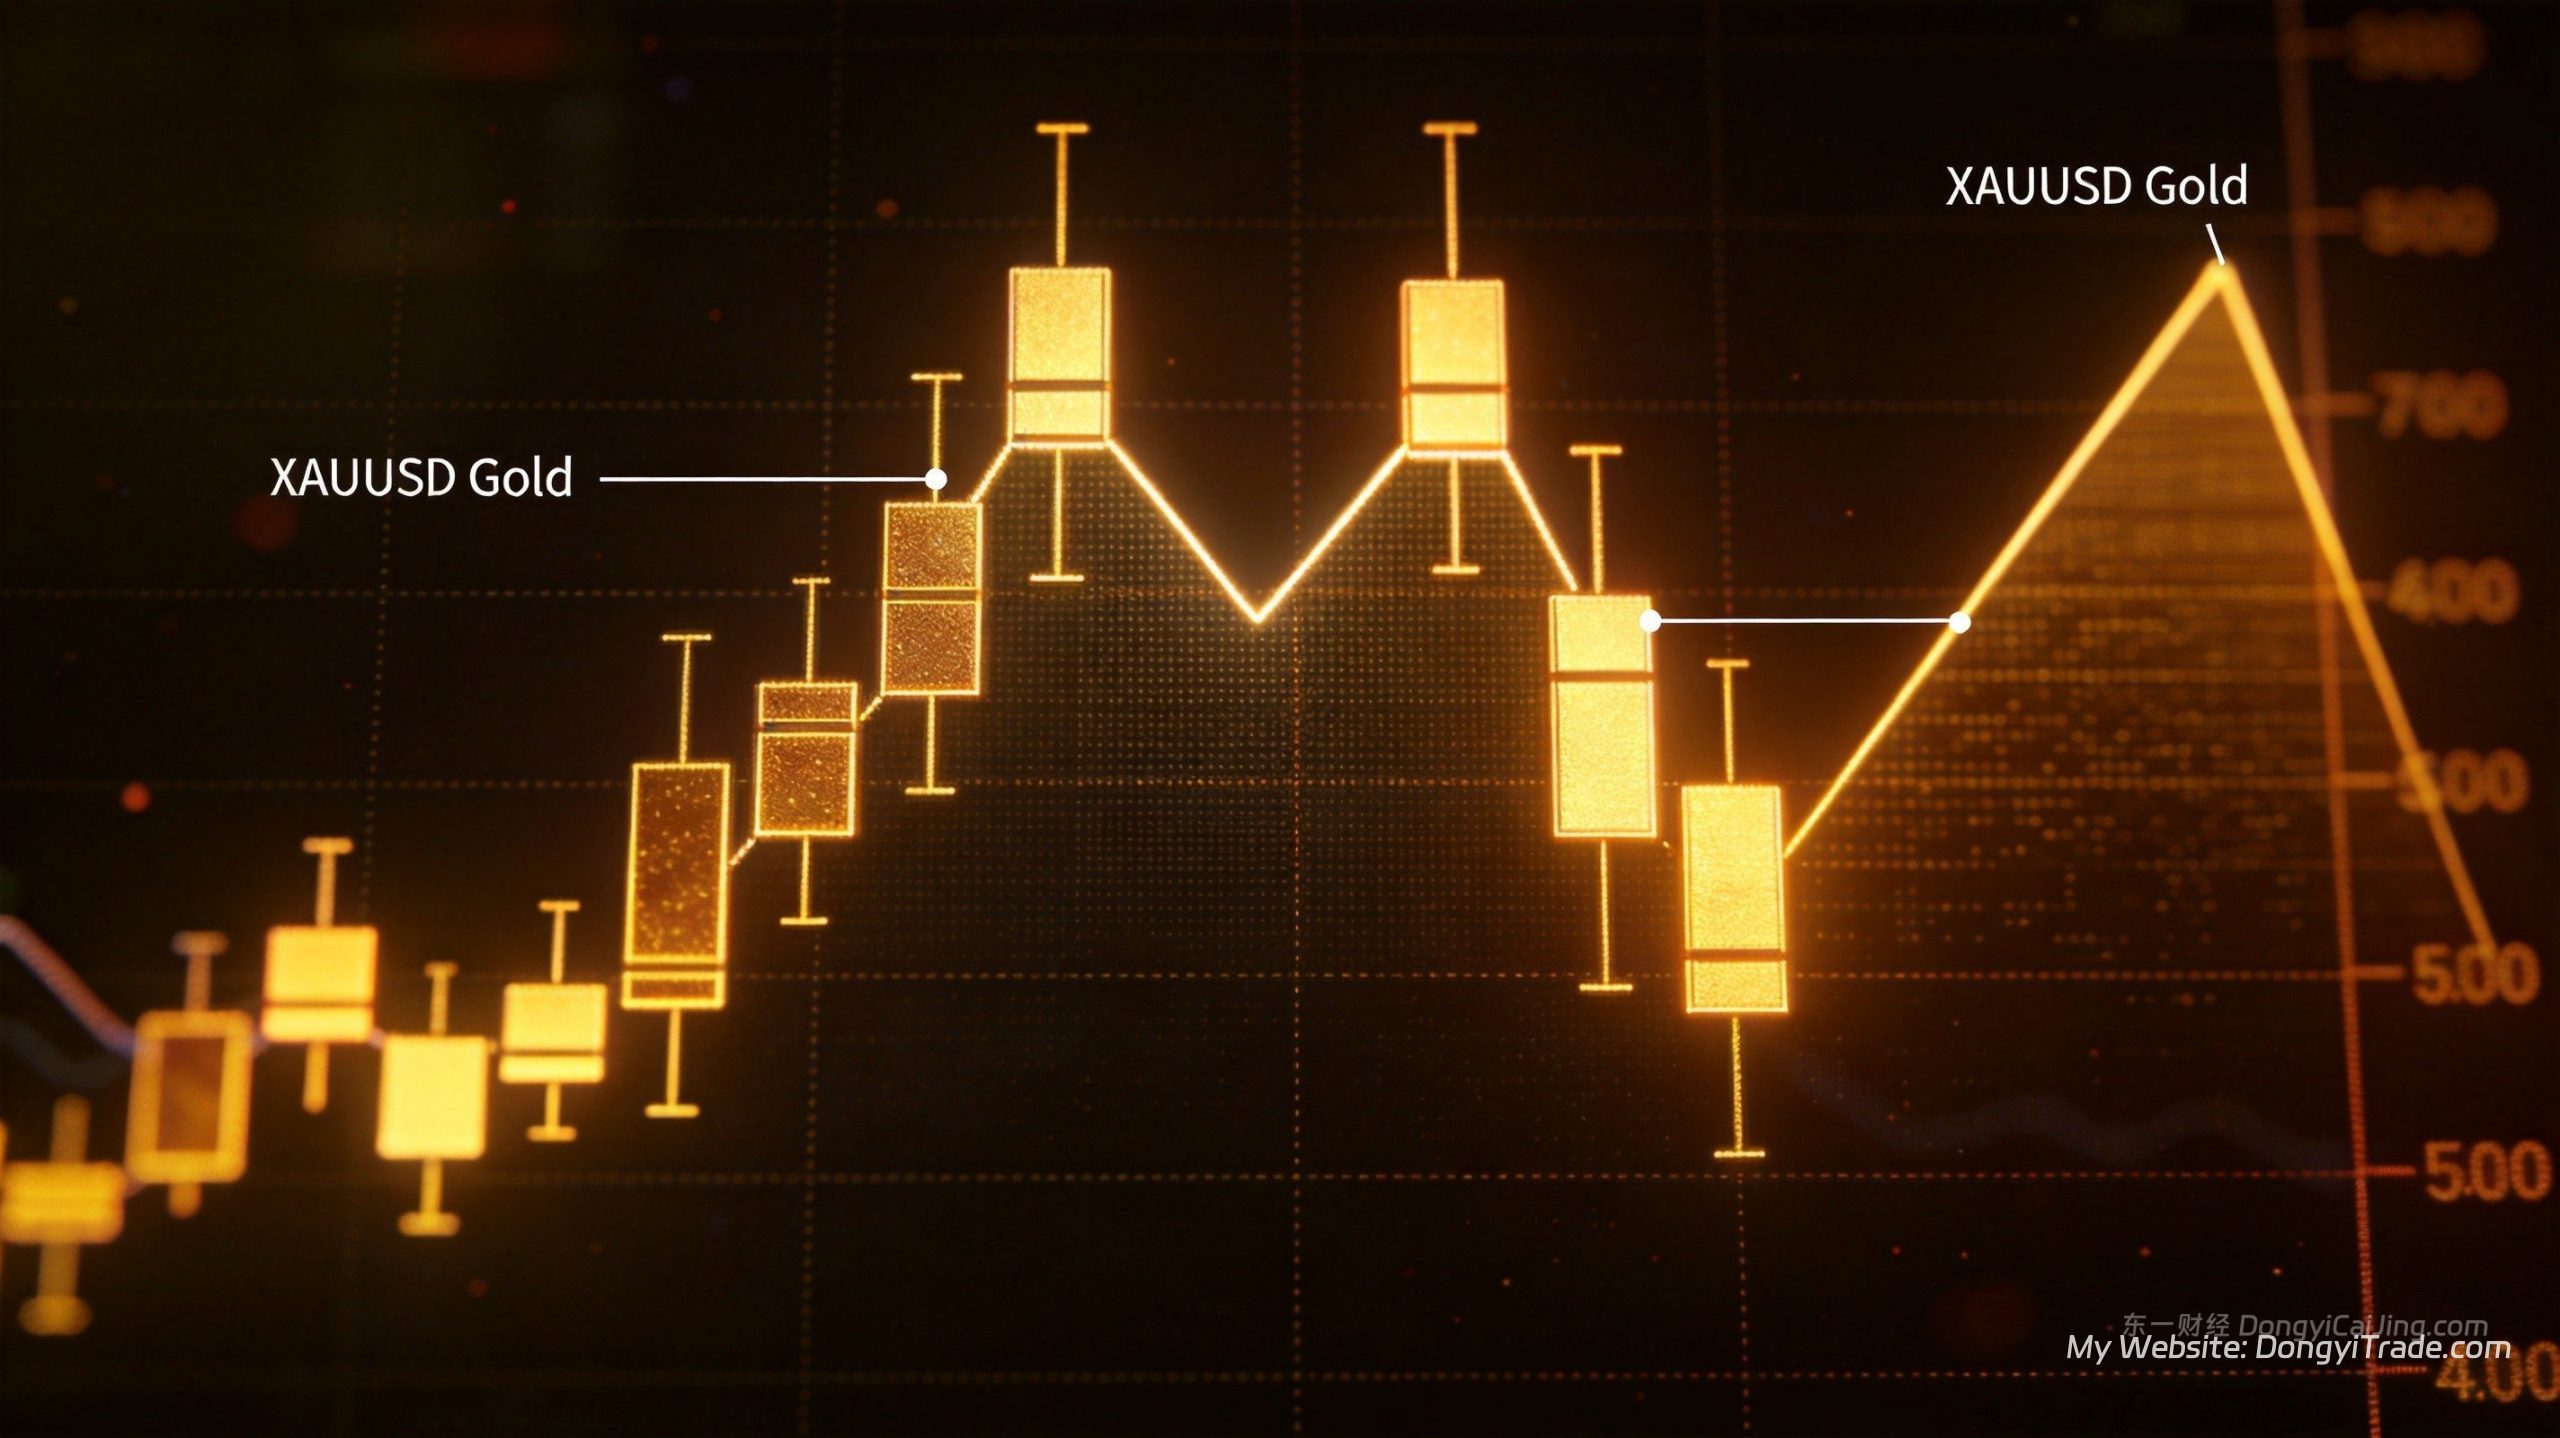
The verdict up front: on XAUUSD daily charts, head and shoulders is the highest-quality pattern — a 63.5% win rate with a 2.1 payoff ratio. Double tops and bottoms come second at 58.2%. Triangle breakouts fire the most signals, but 45.3% of them are fakeouts. Trade them unfiltered and you are donating money to the market.
Spot gold briefly lost the $4,130 handle this morning, printing $4,128.51, after losing more than 3% last week while US 10-year and 30-year Treasury yields hit 24-year highs. Price is chopping inside a $4,100–$4,300 box ahead of Wednesday’s FOMC September minutes. In this kind of tape, how you read and filter patterns decides your transaction costs — and your survival.
Chart Patterns vs Candlestick Patterns: Know the Difference
Chart patterns are built from dozens of candles and capture the medium-term battle between buyers and sellers. Head and shoulders, double tops and bottoms, triangles and flags all belong here. They typically take two weeks or more to form and signal swing-level moves.
Candlestick patterns — hammers, engulfing bars and the like — are made of one to three candles and only govern the next one to three days. The two families complement each other: chart patterns set your directional bias, candlestick patterns fine-tune your entry.
As Edwards and Magee defined it in their classic Technical Analysis of Stock Trends, a pattern is a “coiling structure that precedes a supply-demand imbalance.” The cleaner the structure and the longer it takes to build, the more durable the move that follows the break.
The 10-Year Backtest: Four Patterns Ranked
We scanned XAUUSD daily data from January 2016 through September 2026 with fixed pattern-recognition rules. Starting capital $10,000, fixed 0.1 lots, a $0.35 spread charged per trade, entry on a neckline or boundary break, stop placed 1 ATR beyond the pattern extreme.
| Pattern | Signals | Win Rate | Payoff Ratio | Avg Hold | Avg P/L per Trade |
|---|---|---|---|---|---|
| Head & Shoulders (top/bottom) | 87 | 63.5% | 2.1 | 11 days | +$86 |
| Double Top / Bottom | 124 | 58.2% | 1.8 | 8 days | +$54 |
| Triangle Breakout | 156 | 54.7% | 1.9 | 6 days | +$41 |
| Flag Continuation | 98 | 57.1% | 1.7 | 5 days | +$38 |
Three takeaways. First, head and shoulders fires the fewest signals but the best quality — a 63.5% win rate paired with a 2.1 payoff makes its expectancy untouchable. Second, triangles are the most active pattern with 156 signals in ten years, yet nearly half are fakeouts. Third, flags resolve fastest, which suits traders running a quick swing cadence.
Thomas Bulkowski’s Encyclopedia of Chart Patterns — the reference work on US equities — likewise ranks head and shoulders first in reliability, with roughly 55% to 63% of downside breaks reaching their measured target. Gold’s stronger trending character pushes those odds even higher.
Head and Shoulders: Trading the Win-Rate King
The neckline is the whole game. Connect the two reaction lows between the left shoulder, head and right shoulder. The pattern only exists once price closes decisively through that line. Entering early while the right shoulder is still forming is where most of the losses come from.
The measured target is simple arithmetic: project the vertical distance from the head’s extreme to the neckline from the breakout point. When gold carved out a head and shoulders top near $5,100 in November 2025, the head-to-neckline distance was about $280 — price ultimately fell $310, a 111% achievement rate.
One refinement from our data: waiting for a neckline retest after the break lifts the win rate from 63.5% to 68.9%. The trade-off is that roughly 30% of signals never pull back and leave without you. In trending markets, enter on the break; in ranging markets, demand the retest.
Fakeout Filters: Taking Triangles from 54.7% to 62.3%
Triangles are the fakeout factory. Of the 156 breakout signals in our sample, 45.3% failed. Inside a wide box like the current $4,100–$4,300 range, almost half of all boundary breaks re-enter the pattern within three candles.
Three filters proved their worth. Close confirmation: require the close to clear the boundary by at least 1.5%, killing wick fakeouts. Retest confirmation: wait for price to pull back to the broken boundary and hold. ATR confirmation: the breakout day’s true range must exceed 1.2 times the 14-day ATR, proving real participation.
Stack all three and the signal count drops from 156 to 97, the win rate climbs from 54.7% to 62.3%, and the payoff ratio improves from 1.9 to 2.4. You trade 38% less and make 21% more. That is what filtering buys you.
The current chart is a live case study. Gold has been coiling between $4,100 and $4,300 since August. A confirmed break and retest of the $4,300 neckline projects roughly $4,500. Lose $4,100 on a closing basis and the measured move opens up toward $3,950.
The 3 Deadly Mistakes Beginners Make with Patterns
Mistake one: front-running an unfinished pattern. Entering because it “looks like” a head and shoulders before the neckline breaks is not pattern trading — it is gambling on a hypothesis. Our samples show entries taken before neckline confirmation carry a win rate 19 percentage points lower than confirmed breaks.
Mistake two: forcing patterns against the bigger trend. A head and shoulders top inside a powerful weekly uptrend fails far more often than the textbooks suggest. During gold’s January 2026 melt-up from $4,200 to $5,602, all three daily head and shoulders top signals failed. Counter-trend patterns deserve half size or no trade at all.
Mistake three: treating the measured target as gospel. The target is a statistical high-probability zone, not a promise. The better play is switching to a trailing stop once price enters the target zone. After the August 2025 double top hit its measured objective, gold kept falling another $140 — traders who exited mechanically at the target left money on the table, while those who held without a trailing plan gave it all back.
Frequently Asked Questions
Should I learn chart patterns or candlestick patterns first?
Start with chart patterns. They define swing direction and forgive noise — a single spiky candle will not invalidate a month-long structure. Candlestick patterns are more precise but far more fragile. Use them as entry triggers inside a chart-pattern framework, never as a standalone reason to trade.
Which chart pattern is best for gold beginners?
The double top and bottom. Its identification rules are the most objective: two peaks or troughs within 1.5% of each other, separated by a clear reaction move. With 124 signals and a 58.2% win rate over ten years, it offers the best balance of frequency and quality for building pattern-recognition skill.
Do chart patterns still work on the 4-hour timeframe?
They work, but downgrade your expectations by one full notch. In our parallel 4-hour backtest, all four patterns lost 4 to 6 percentage points of win rate and produced about 10% more fakeouts. On H4, trade only with-trend patterns and tighten stops to 0.8 ATR to compensate for the lower hit rate.
How long after the break is an entry still valid?
Our data shows expectancy holds up if you enter within three daily candles of the break. Chase after five candles and average profit drops roughly 40%, because most of the measured-move distance is already gone. Miss the first three candles and wait for the retest instead of chasing.
How should I trade the current $4,100–$4,300 gold box?
Treat it as a contraction structure: fade the $4,300 ceiling, buy the $4,100 floor, with stops 1 ATR (about $58) outside the box. The moment price closes beyond either boundary and confirms with a retest, flip to swing mode immediately — the measured objective from a box break is roughly $200 in the direction of the break.
For single-candle entry triggers inside these structures, read our Candlestick Pattern Recognition guide for XAUUSD. For the entry mechanics after a pattern boundary breaks, see the Breakout Trading Strategy Complete Guide. And for drawing the boundaries themselves, check Support and Resistance in XAUUSD Trading.
About the author: Dongyi Guo is a professional quantitative trader focused on XAUUSD gold strategy research and live execution, running Dongyi Finance (dongyitrade.com) to share quant strategies and market deep-dives.
Contact: Telegram: @DongyiTrade