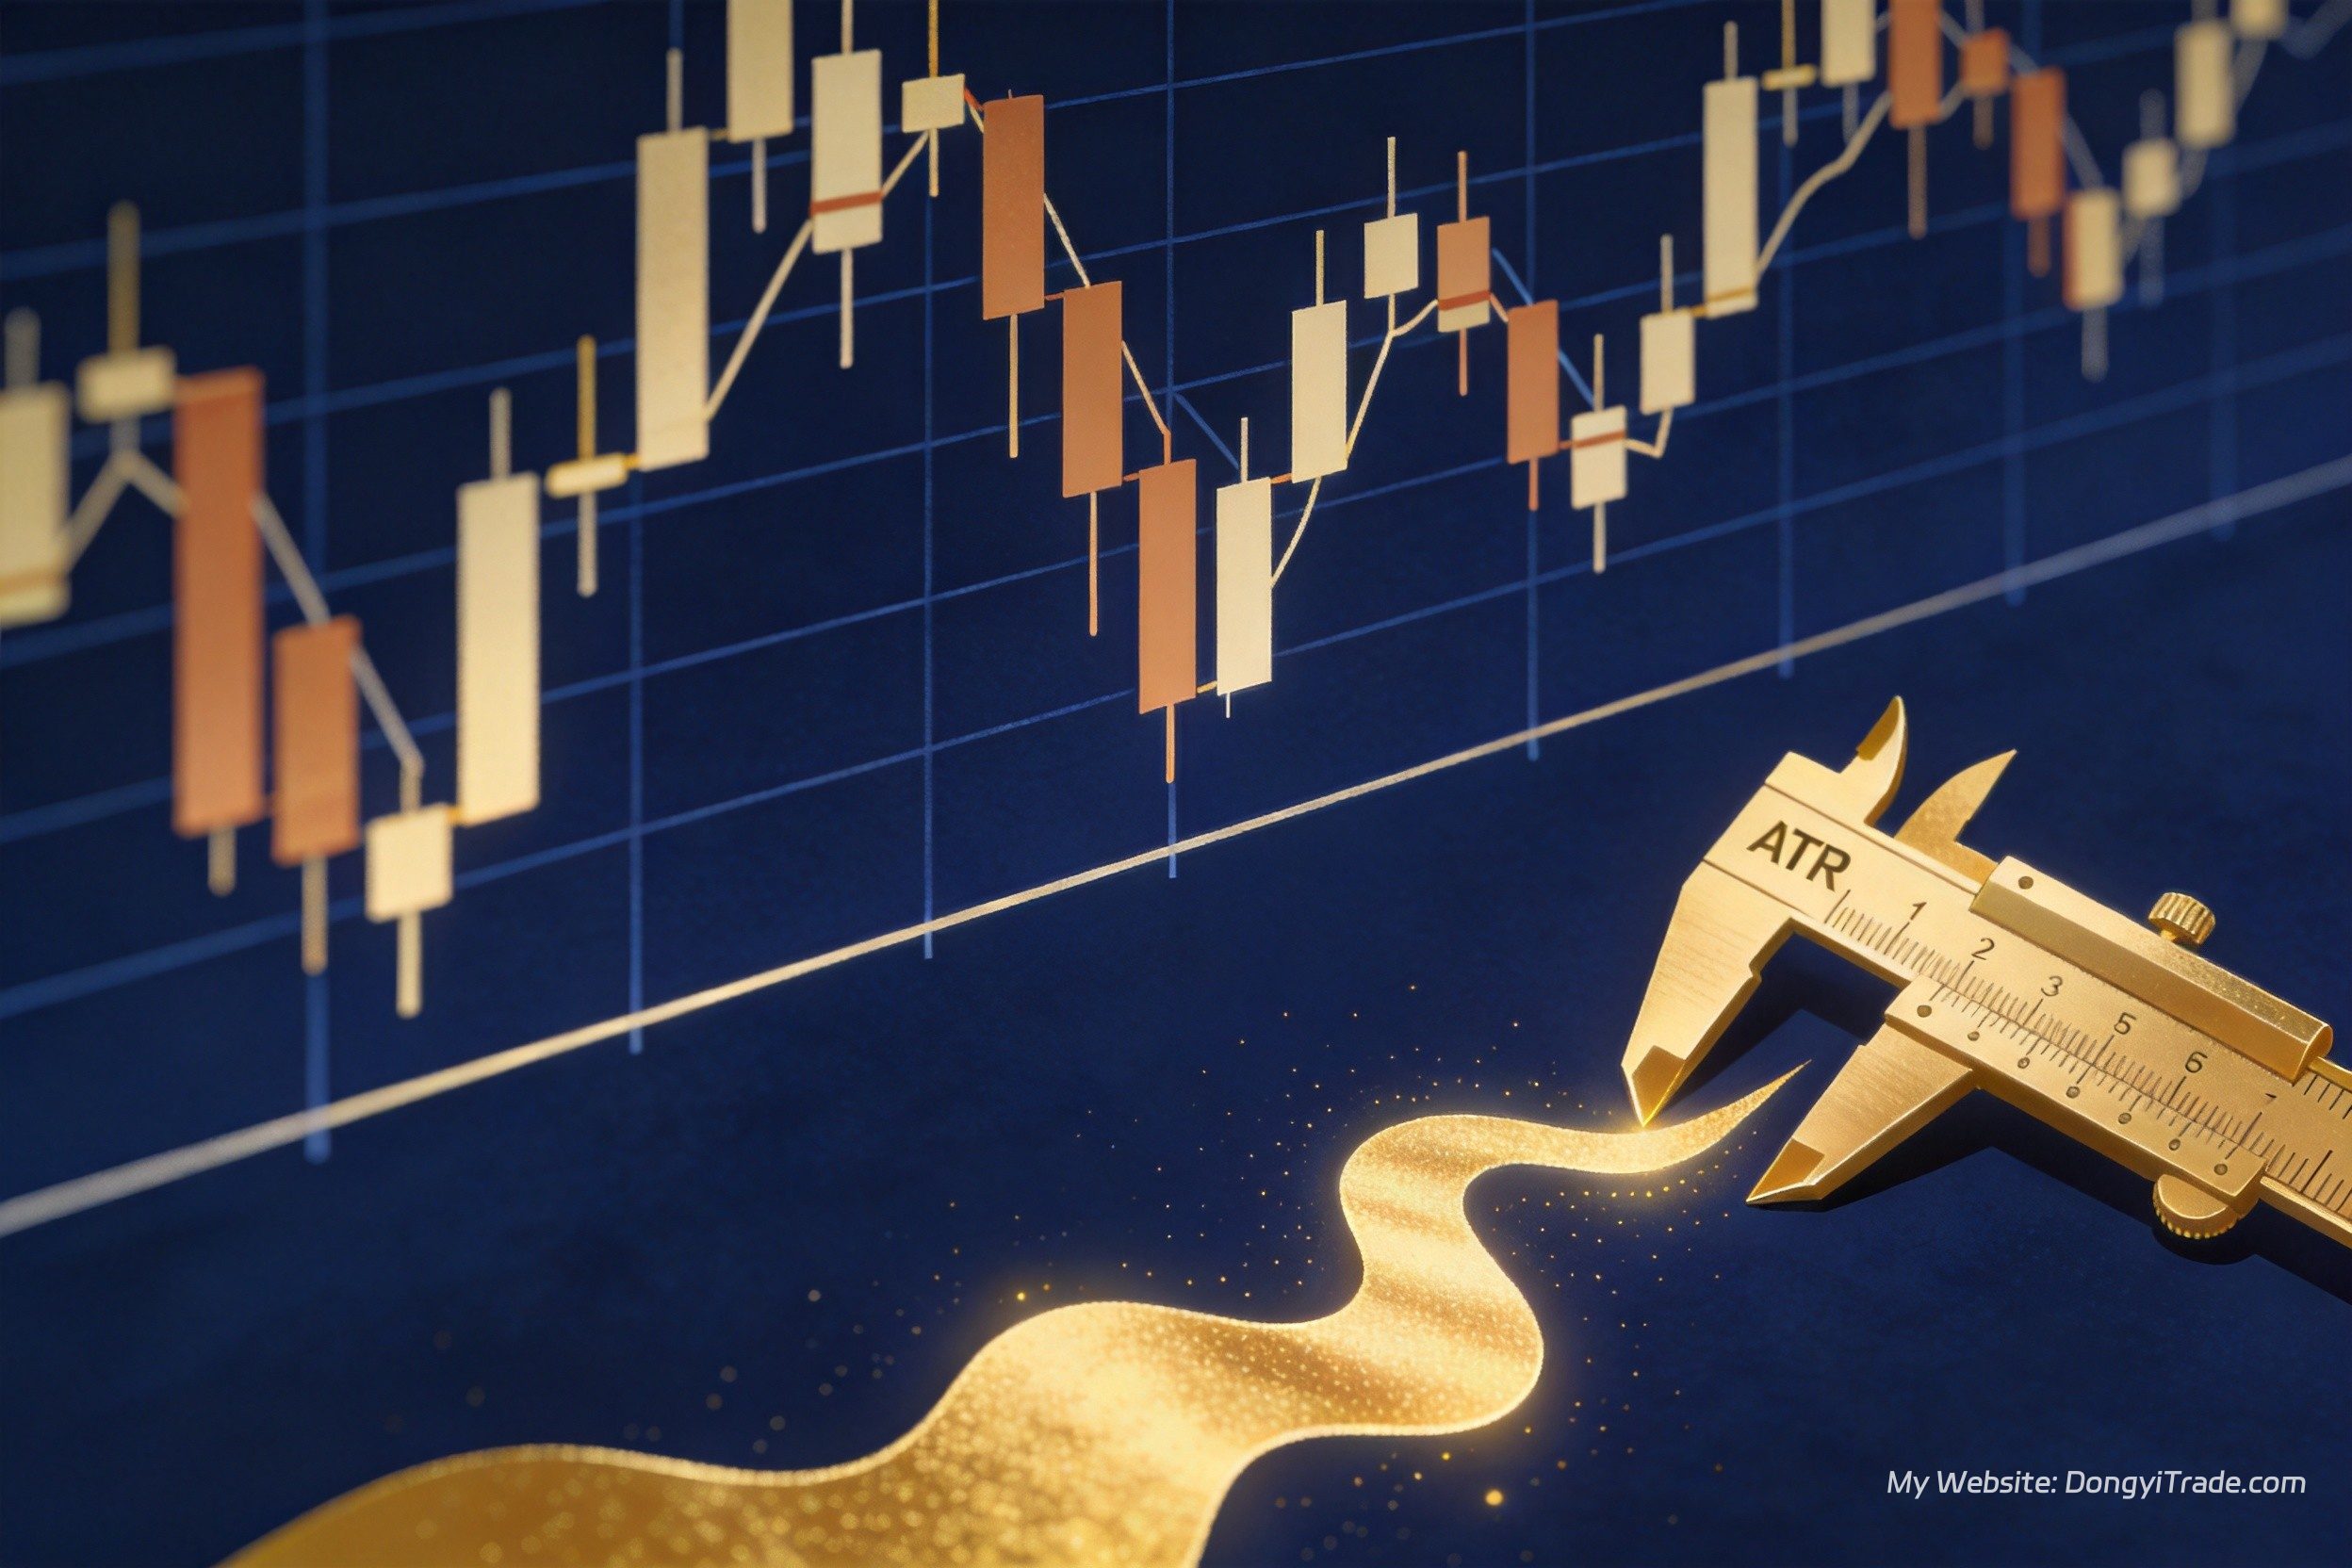
The short answer: ATR (Average True Range) doesn’t predict direction — it takes the market’s temperature. It tells you how many dollars gold normally moves in a day, and both your stop distance and your position size should be derived from that number. In October 2026, XAUUSD’s ATR(14) is roughly $85 — triple the ~$28 reading of the 2024 low-volatility era. If you’re still using 2024’s fixed stop distances, you’re running this year’s race in last year’s shoes.
Right now is exactly when ATR earns its keep: gold has unwound from its January peak of $5,602, broke below the $4,000 round number on October 23, V-shaped +1.1% back above $4,060 on the 27th, and faces an FOMC decision tonight. In a market swinging $50-$110 a day, a hand-waved $20 stop is noise waiting to be harvested.
What ATR Is: Definition and Calculation
ATR was introduced by Welles Wilder in 1978 with a default 14-period setting. For each candle it computes the True Range — the largest of three values:
1. Today’s high minus today’s low; 2. the absolute value of today’s high minus yesterday’s close; 3. the absolute value of today’s low minus yesterday’s close.
Terms two and three exist to capture gap moves — on sessions like Monday October 19, when gold gapped down and reversed higher, a plain high-low range badly understates real movement while True Range doesn’t. Smooth 14 days of True Range with Wilder’s averaging and you get ATR(14). In MT4/MT5, search “ATR” under oscillators and keep the default 14.
Use Case 1: Price Your Stops with ATR
Fixed-dollar stops are the retail trader’s biggest hidden cost. A sane stop must clear the market’s normal noise, and the rule of thumb is 1.5-2x ATR:
| Regime | ATR(14) | 1.5x ATR Stop | 2x ATR Stop | Fate of a Fixed $20 Stop |
|---|---|---|---|---|
| 2024 low-volatility era | ~$28 | $42 | $56 | Workable, still tight |
| October 2026 high-volatility era | ~$85 | ~$128 | ~$170 | Effectively donated to market noise |
A wider stop doesn’t mean bigger risk — exposure is stop distance times position size. Widen the stop and shrink the size proportionally, which is exactly the second use case.
Use Case 2: Reverse-Engineer Position Size from ATR
The quant position-sizing formula is one line: lots = per-trade risk budget ÷ (stop distance × point value). XAUUSD is 100 oz per lot, so $1 of price movement equals $100 per lot. Take a $10,000 account risking 1.5% ($150) per trade:
| Item | 2024 Low-Vol Era | October 2026 High-Vol Era |
|---|---|---|
| Account equity | $10,000 | $10,000 |
| Risk budget (1.5%) | $150 | $150 |
| ATR(14) | ~$28 | ~$85 |
| Stop distance (1.5x ATR) | $42 | ~$128 |
| Position size | ~0.36 lots | ~0.12 lots |
Same account, same risk budget — the correct size in 2026 is one-third of 2024’s. Many traders feel their strategy “stopped working” this year; the strategy didn’t change, volatility did, and their size didn’t follow. Price your positions with ATR and your equity curve smooths out immediately.
Use Case 3: The ATR Percentile as a Regime Filter
The most underrated use: drop the current ATR into its one-year distribution, compute the percentile, and let it decide what kind of trades you’re allowed to take:
Below the 20th percentile: volatility compression — bench trend strategies, run mean reversion and range plays. Between 20% and 80%: normal regime — execute as planned. Above 80%: extreme volatility — halve position size, stop chasing breakouts, take profits in tranches. XAUUSD’s ATR percentile has sat above 85% through October, which is the quantitative explanation for why breakout entries have been repeatedly faked out lately while mean-reversion win rates have climbed.
Live Application: The Chandelier Exit
ATR’s classic exit tool is the Chandelier Exit: while holding a long, trail the stop at “highest high since entry − 3x ATR,” ratcheting up only. While the trend runs it hangs far below price; when the trend fades and price retraces more than 3x the daily range, it takes you out. Applied to today’s chart: if gold builds a winter rally off the $3,975 double bottom toward $4,300 with ATR near $85, the chandelier line sits around $4,300 − $255 = $4,045 — locking in trend profits without an early exit.
FAQ
What ATR reading counts as “high”?
ATR has no absolute high or low — judge it relatively. Two reference frames: ATR as a percentage of price (normal for XAUUSD is ~1%-1.5%; above 2.2% is high volatility), and the current ATR’s percentile within its one-year distribution, with above 80% marking an extreme-volatility regime.
How many ATR multiples should my stop be?
Intraday: 1-1.5x. Swing: 1.5-2x. Trend-following exits: 3x (the chandelier). Tighter multiples get swept by noise more often; wider multiples deepen per-trade drawdown — always pair the multiple with the position-sizing formula so total risk stays constant.
What’s the difference between ATR and Bollinger Band width?
Both measure volatility but from different angles. ATR is built on True Range, captures gaps, and answers “how many dollars does the market actually move per day” — best for stops and sizing. Band width is built on closing-price standard deviation and answers “how dispersed is price around its mean” — best for spotting squeezes before expansions. They complement rather than replace each other.
How do I add ATR in MT4?
Insert → Indicators → Oscillators → Average True Range, keep the period at 14. It plots in a sub-window, denominated directly in dollars. Add a manual horizontal line at the past year’s median ATR as your high/low volatility benchmark.
For the full sizing math beyond ATR, read Position Sizing Complete Guide: Kelly Criterion, Fixed Fractional and ATR Methods. For the trailing-stop toolkit, see Trailing Stop Loss Complete Guide. For when volatility peaks intraday, check The Best Time to Trade Gold.
About the author: Dongyi Guo, professional quantitative trader focused on XAUUSD gold strategy research and live trading, running Dongyi Finance (dongyitrade.com) to share quant strategies and in-depth market analysis.
Contact: Telegram: @DongyiTrade