Straight to the point: after a string of losses, the real danger is not the losses themselves but the behavioral spiral triggered by the urge to win it back. My own live-account statistics show that after two consecutive losing trades, the execution error rate on the third trade jumps by roughly 60%. In a drawdown, job number one is not making money — it is stopping the bleeding.
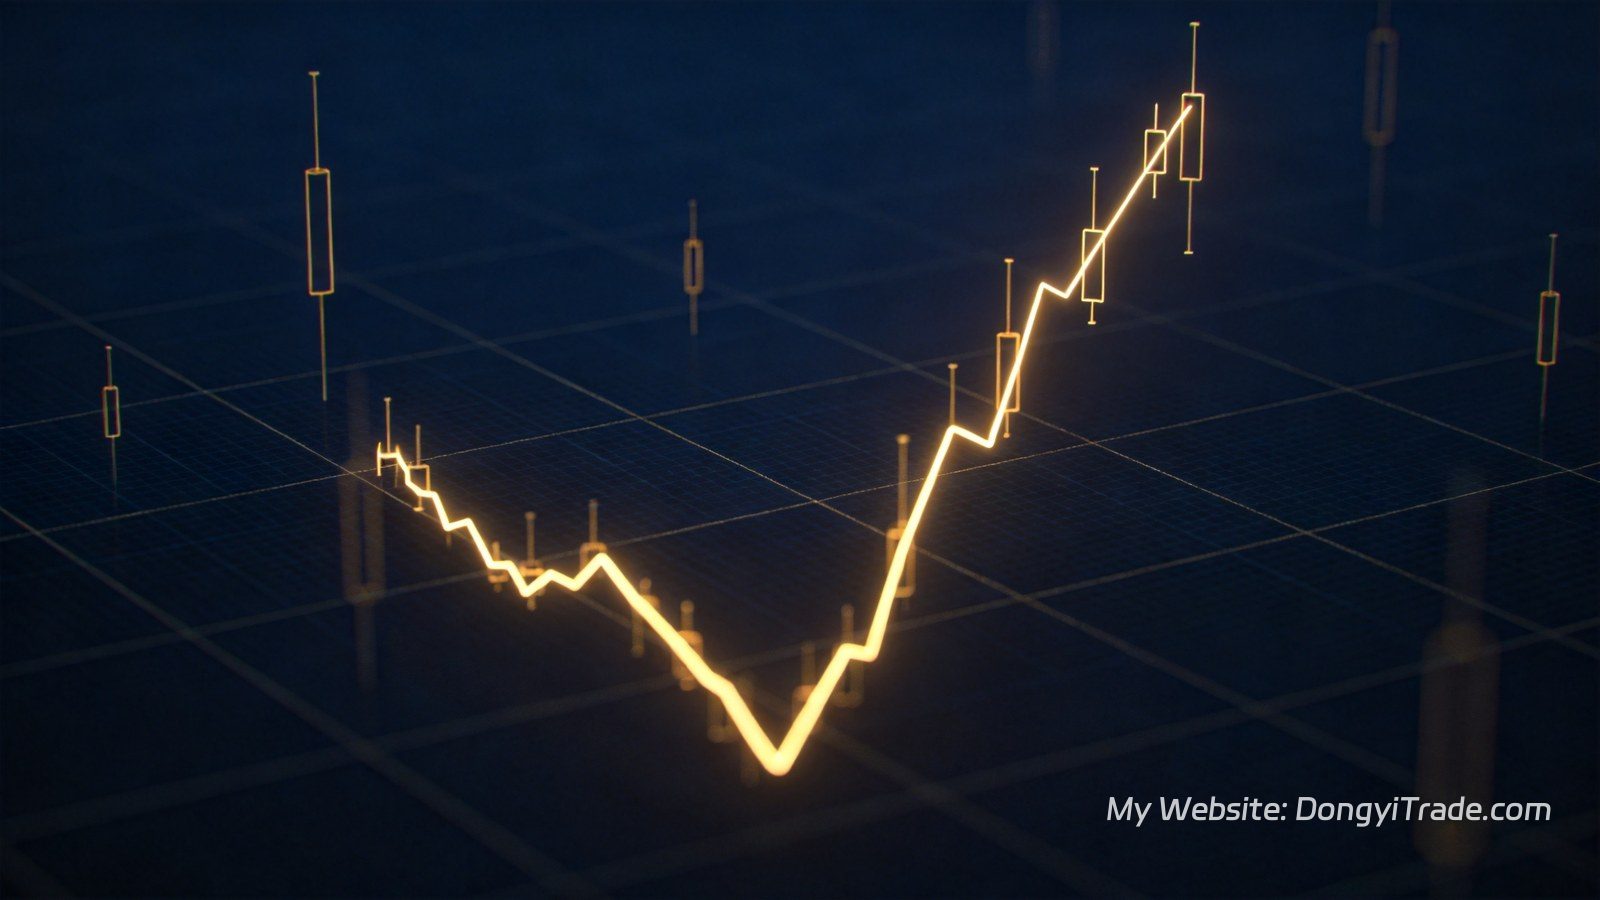
Last week (October 5-9) was a textbook meat grinder: gold first broke below a two-month low at $4,066, then staged a V-shaped rebound to close the week at $4,194 — an intraweek swing of more than $140. This kind of “kill the longs, then squeeze the shorts” price action is exactly where consecutive losses are born. If your account took a hit this week, this recovery playbook is for you.
The Math of Drawdowns: Lose 50% and You Need +100% to Recover
Most traders underestimate drawdowns because of the brutal asymmetry between losing and recovering. A 50% equity decline requires a 100% gain just to get back to breakeven — and most traders’ psychology starts cracking around -20%.
| Drawdown | Gain Required to Recover | Difficulty |
|---|---|---|
| -5% | +5.3% | Easy |
| -10% | +11.1% | Normal |
| -20% | +25% | Hard |
| -30% | +42.9% | Dangerous |
| -40% | +66.7% | Critical |
| -50% | +100% | Most accounts never come back |
This is why professional traders rank drawdown control above return chasing. Doubling your per-trade risk does not double the probability of a deep drawdown — it raises it exponentially.
The Real Killer After Consecutive Losses: Revenge Trading
Loss aversion in behavioral finance tells us that the pain of a loss is roughly twice the pleasure of an equivalent gain. After a losing streak, your brain instinctively pushes you to “get the money back,” producing the classic revenge-trading chain: urgency to recover, oversized positions, relaxed entry criteria, another loss, and total emotional collapse.
I ran the numbers on my own trading journal: after two consecutive losers, the third trade’s error-tag hit rate rises by about 60% versus my normal state. The three most frequent errors are chasing price, oversizing positions, and unplanned trades. In other words, after a losing streak you are no longer facing the market — you are facing a hijacked version of yourself.
The Five-Step Recovery Protocol (Verified on Live Accounts)
Step 1: Hard circuit breaker. Three consecutive losses, or a daily equity drawdown beyond 3%, and you stop trading for the day — no exceptions. This is a hard clause in my trading plan, designed to cut the “loss, size up, bigger loss” death spiral.
Step 2: Downshift position size. Cut per-trade risk from 1% straight to 0.25% (the sizing math is in my position sizing complete guide) — one quarter of your normal size. The goal is not profit; it is re-confirming at minimal cost that your system still works.
Step 3: Journal attribution. Export your last 20 trades and cluster them by error tag — the full template is in my forex trading journal guide — the MT5 account history on ECMarkets exports complete order records in one click. Then answer one question honestly: is the strategy broken, or is the execution broken? In my experience, 90% of drawdowns are the latter.
Step 4: A-grade setups only. During recovery, trade only the highest-quality setups defined in your plan. Miss trades rather than force them. If your state is shaky, run 10 trades on an ECMarkets demo account first to rebuild execution rhythm at zero cost, then return to live.
Step 5: Graduated re-scaling. After equity returns to its pre-drawdown high, restore risk to 0.5% per trade first, hold it steady for two weeks, and only then return to the standard 1%. Accounts that re-scale too fast almost always double-dip on the next volatility spike.
Live Case Study: 12% Drawdown to New Equity High in 7 Weeks
In Q3 last year, my XAUUSD trend-following model went through a 12.3% equity drawdown that triggered every risk-control clause. The full repair process is below.
| Phase | Action | Result |
|---|---|---|
| Week 1 | Stopped trading for 2 days, audited 20 trades | Found 70% of losses came from just two error tags: “early entries” and “gambling on news” |
| Weeks 2-4 | 0.25% risk, A-grade trend-pullback setups only | 11 trades, 7 winners, equity recovered 6% |
| Weeks 5-6 | Restored risk to 0.5% | Equity back at pre-drawdown high |
| Week 7 | Restored standard 1% risk | New equity high |
The biggest lesson: recovery speed depends on how decisively you downshift, not on whether the market cooperates. A parallel test account running the same strategy without downshifting saw the drawdown widen to 21% and took 9 extra weeks to recover.
FAQ
How much drawdown is normal?
Benchmark against your strategy’s historical maximum drawdown. Anything within 1.5x that historical max is normal noise and needs no intervention; beyond 1.5x, downshifting is mandatory. My XAUUSD trend model’s historical max drawdown is 9%, so my red line is 13.5% — touch it and position size is halved. It is a rule, not a discussion.
After how many consecutive losses should I stop?
My hard rule is three in a row. More important than the count is a daily equity drawdown threshold (mine is 3%). A single stop-out is a strategy cost; three straight losses usually mean your state or the market regime has changed, and continuing to trade hands the steering wheel to emotion.
Should I switch strategies during a drawdown?
No. Attribute first, adjust second. Statistically, 90% of drawdowns come from execution drift rather than strategy failure — switching systems mid-drawdown means abandoning a working system at its lowest point. Only consider parameter-level tuning when attribution confirms a structural regime change (e.g., a volatility shift), and always validate on demo before going live.
Will demo trading during recovery hurt my live edge?
No. Demo trains execution process, not P&L adrenaline — and rebuilding disciplined rhythm is exactly what recovery requires, best done without real-money emotional interference. Return to live after 10 consecutive demo trades with zero execution drift, bridge back with small size, and your feel will not fade.
Should I watch single-trade losses or equity drawdown?
Equity drawdown is the only metric that matters. Individual losses are normal strategy costs; the drawdown curve reflects the health of the entire system. Write stops, losing-streak circuit breakers, and downshift thresholds as equity-based hard rules — that is how you replace willpower with a system.
💡 Key Takeaways
- Drawdown math is asymmetric: lose 50% and you need +100% to recover — drawdown control always outranks return chasing.
- After two straight losses, the third trade’s error rate rises by about 60%; revenge trading is the number-one account killer.
- Five-step recovery protocol: circuit breaker, size downshift, journal attribution, A-grade setups only, graduated re-scaling.
- Never switch strategies mid-drawdown — attribute first; 90% of drawdowns are execution drift, not strategy failure.
- Watch equity drawdown, not individual trades; write downshift thresholds as hard rules and let the system replace willpower.
About the Author: Dongyi, professional quantitative trader focused on XAUUSD gold trading strategies, running DongyiTrade (dongyitrade.com), sharing quantitative trading strategies and in-depth market analysis.
Contact: WeChat: DongyiTrade | Telegram: @DongyiTrade