Most trend strategies don’t lose money because they call the wrong direction. They lose money because they take trend trades in markets that have no trend. Gold has been boxed in a $3,850–$4,000 range for weeks after retracing nearly 30% from its January peak of $5,602 — the kind of tape where MACD crosses whipsaw you to death and moving averages tangle into noise. Is there an indicator that answers the question that comes before every other question: is there even a trend right now? Yes. It’s called ADX.
The Average Directional Index is one of the very few tools in technical analysis that measures strength while ignoring direction. Its core value isn’t telling you whether to buy or sell — it’s telling you whether a trend strategy should be switched on at all. That single act of filtering decides the survival of most trading systems.
Origins and Anatomy: One of Wilder’s Three Trend Tools
ADX was published in 1978 by J. Welles Wilder in his book New Concepts in Technical Trading Systems. Wilder, a mechanical engineer turned analyst, is the most prolific indicator designer in the history of technical analysis: RSI, ATR, Parabolic SAR and ADX all came from the same mind. That’s why these tools combine so naturally — they were engineered as modules of one system.
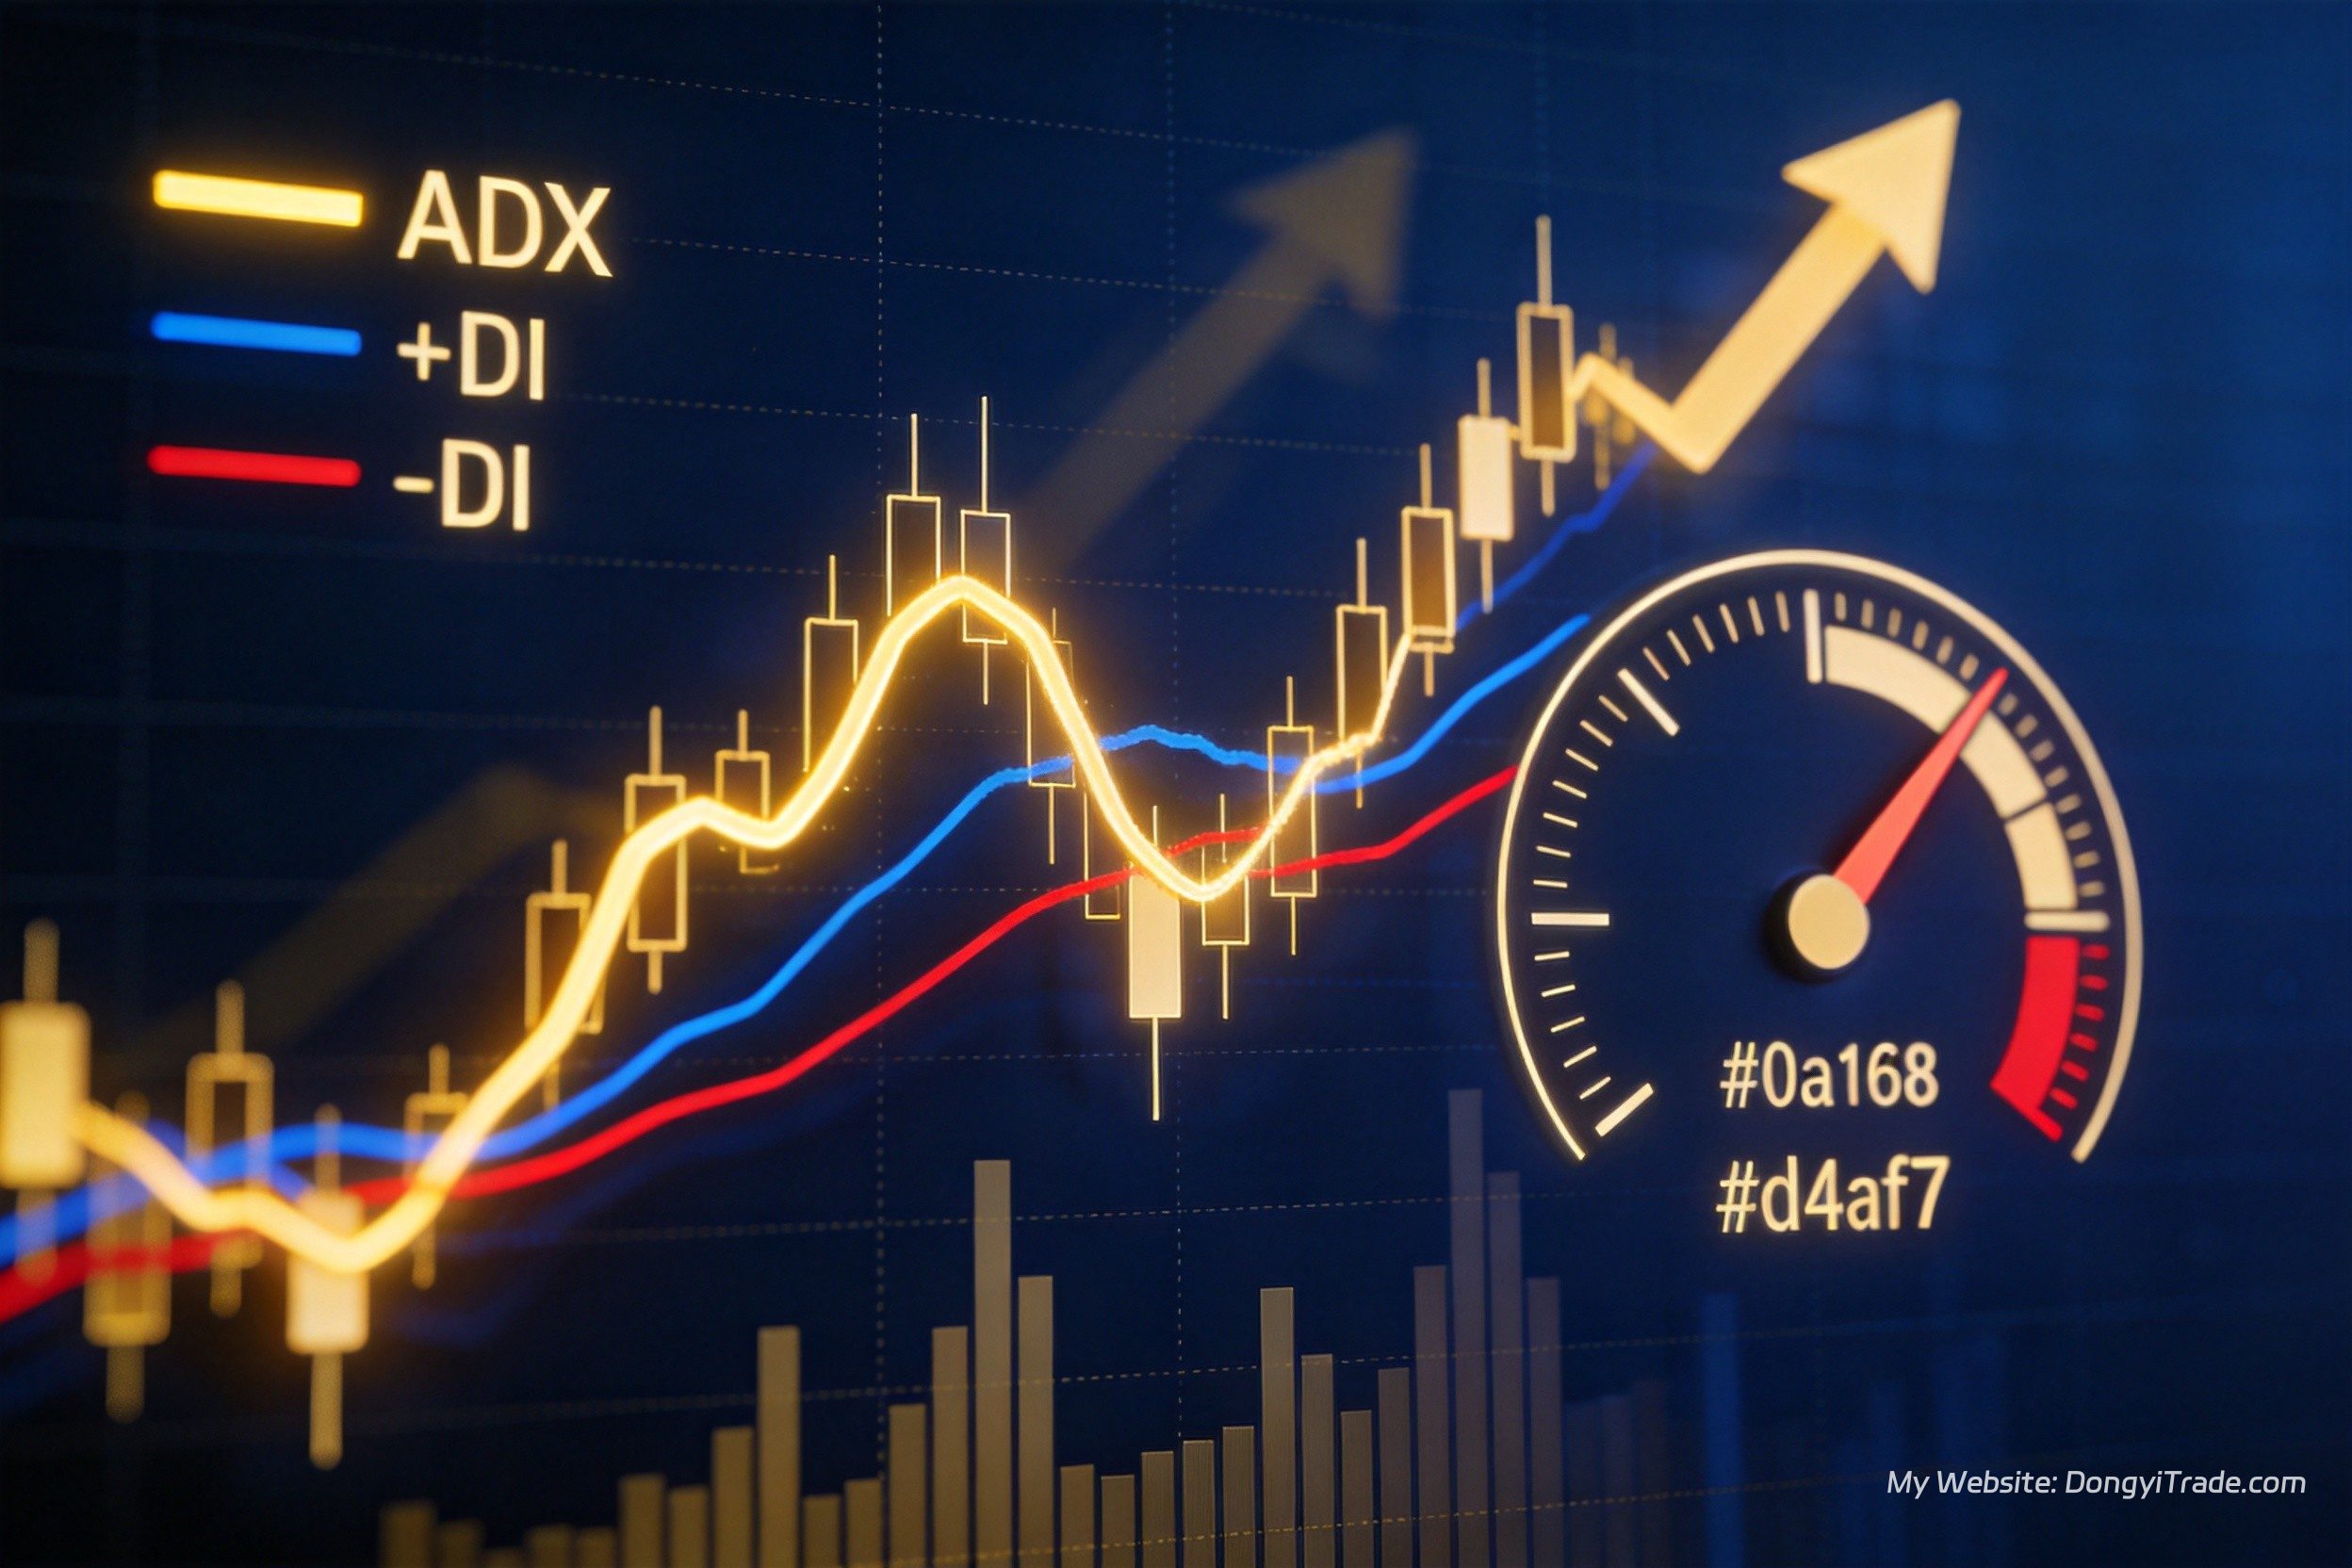
The full Directional Movement Index (DMI) framework has three lines: +DI (positive directional indicator, measuring buying pressure), -DI (negative directional indicator, measuring selling pressure), and ADX (a smoothed average of the spread between them, measuring trend strength). The default period is 14. The division of labor is clean: direction comes from whichever DI line is on top; conviction comes from the ADX reading.
One widely misunderstood point: ADX itself carries no bullish or bearish meaning. If gold is falling hard while ADX climbs from 20 to 40, the message is “this downtrend is strengthening,” not “a reversal is coming.” All directional information lives in +DI and -DI; ADX only answers “how much should I trust this move?”
The 20/25/40 Thresholds: Gold’s Three Gears of Trend Strength
ADX reads on a 0–100 scale, and three thresholds matter in practice. For a high-volatility instrument like XAUUSD, each zone maps to a different market state and a different playbook:
| ADX Zone | Market State | Strategy Choice | Position Sizing |
|---|---|---|---|
| Below 20 | Trendless chop; false breakouts everywhere | Switch off trend systems; stand aside or flip to mean-reversion/grid | Minimal or flat |
| 20–25 | Trend incubation, direction unconfirmed | Probe with light size; wait for the break above 25 | Half of normal |
| 25–40 | Valid trend; highest-quality signals | Prime territory for trend following | Normal size |
| Above 40 | Strong trend, but reversal risk is compounding | Stay with the trend but tighten exits; use stops of 2x ATR or wider | Scale down, take partial profits |
| Above 50–60 | Extreme trend, usually news-driven | Beware violent snapbacks; never chase | Reduce only, no new entries |
One practical detail worth memorizing: the moment ADX crosses up through 20 is often the best entry window — the trend is freshly confirmed but not yet spent. By the time ADX prints 50, you’re usually paying the early birds. Gold’s news-driven personality makes this worse: a major data release can spike ADX above 50 in minutes, then one counter-candle erases every dollar of open profit.
EA Test Data: What’s One Filter Worth?
The most common professional use of ADX is as an EA’s trade-permission switch: trend signals only fire when ADX sits inside a defined window, typically 20–50. According to backtesting data circulating in the gold EA development community, adding a minimum ADX threshold to a trend system cuts trade count by roughly 20–30% — but win rate and maximum drawdown both improve materially, because the trades you removed were precisely the low-quality ones fired inside ranges. Trading 30% less in exchange for a tighter drawdown is a swap that almost always makes mathematical sense.
A classic XAUUSD trend-confirmation framework looks like this: on the 30-minute chart, ADX(14) above 25 confirms a trend exists; +DI above -DI establishes long bias; a completed Morning Star or Hammer times the entry. The stop is 1.5x ATR(14), the minimum reward-to-risk is 2:1, and when ADX decays back below 20 the system exits on its own — the trend has died, so the trade has no reason to live. Backtest discipline for this family of strategies: at least 24 months and 80+ trades, profit factor above 1.3, and maximum drawdown of 8–12% when risking 1% per trade. For stop sizing, cross-reference our ATR masterclass; for confirmation logic, the signal-grading approach in our Ichimoku guide applies the same philosophy.
ADX also obeys a stable session rhythm: institutional order flow in the London–New York overlap frequently pushes readings above 25, while Asian hours often sit in a low-energy 12–18 band. Many EAs embed ADX monitoring to raise activity in high-quality sessions and shrink size in dead ones — essentially automating the session playbook without any manual intervention from the trader.
Applied to Today’s Tape: What ADX Says Inside the $3,850–$4,000 Box
Run the framework on the current chart. Gold has oscillated in a $3,850–$4,000 box for weeks, and daily ADX is sitting at low levels — the textbook definition of a trendless market. In this zone, chase-and-panic trend tactics bleed money by a thousand cuts. There are exactly two correct actions: switch to mean-reversion tactics (buy the lower boundary, lighten up at the top), or sit flat and wait for ADX to reclaim 25. A strategy-switching regime like this is also where curve-fitting risk is highest — if you’re tempted to retune parameters until the backtest looks pretty, read our piece on backtest overfitting first.
The catalysts to watch this week: midterm results tonight, the Bank of England on Thursday, payrolls on Friday. Any one of them can yank ADX back above 25 — and when that happens, the relative position of +DI and -DI will tell you the direction of the break. That’s the elegance of the ADX framework: it never predicts; it only confirms, and it converts the stress of “guessing direction” into the discipline of “waiting for the signal.”
How ADX Divides Labor With Other Trend Tools
| Dimension | ADX/DMI | MACD | Moving Averages | Ichimoku |
|---|---|---|---|---|
| Core question answered | Is there a trend, and how strong | Momentum direction and turns | Trend direction | Trend + support/resistance + time |
| Behavior in ranges | Sits low, a built-in alarm | Frequent false signals | Tangles and fails | Cloud filters chop |
| Best role | Trade-permission filter | Signal trigger | Directional baseline | All-in-one framework |
| Lag | High (smoothing) | Medium | Medium-high | High |
| Standalone value | Low; needs DI lines | Medium | Medium | High |
The recommended division of labor: ADX decides whether to trade and which strategy family to deploy; +DI/-DI or a moving average decides direction; ATR sizes the stop and the position; candlestick structure times the entry. Each indicator answers exactly one question and never trespasses on another’s job — far more robust than asking any single tool to do everything.
FAQ
Should I speed up the default ADX period of 14?
No. Wilder’s 14-period setting has survived decades of cross-market validation. Shortening it makes ADX flicker across the 25 line on every other bar, which destroys the very filtering function you’re using it for. ADX’s value is stable regime detection, not speed. If signals feel slow, step down a timeframe — from daily to 4-hour, say — rather than touching the parameter.
ADX is above 25 but price is going nowhere. What’s happening?
Two possibilities. First, lag: ADX is smoothed, so after price stalls it keeps drifting higher on inertia. Second, a violent two-way tug-of-war: +DI and -DI crossing repeatedly can inflate ADX artificially. The tell is the spread between the DI lines — a high ADX with glued-together lines is a phantom trend; a high ADX with the lines spreading apart is the real thing.
Can ADX be used alone as an entry signal?
Never. ADX has no directional content; using it alone is flipping a coin on direction. The standard stack is “ADX for strength + DI for direction + candlestick or moving average for timing,” or as a permission filter inside an EA.
ADX is below 20 in a range. Does that mean do nothing?
It means stop doing trend trades — not stop trading. Low ADX is the high-win-rate habitat of mean-reversion and grid strategies: fade the edges of the box until ADX reclaims 25, then flip back to trend following. That strategy-switching role is arguably ADX’s single greatest contribution to a system.
About the author: Dongyi Guo, professional quantitative trader focused on XAUUSD gold strategy research and live trading, running Dongyi Finance and sharing quant strategies and in-depth market analysis.
Contact: Telegram: @DongyiTrade