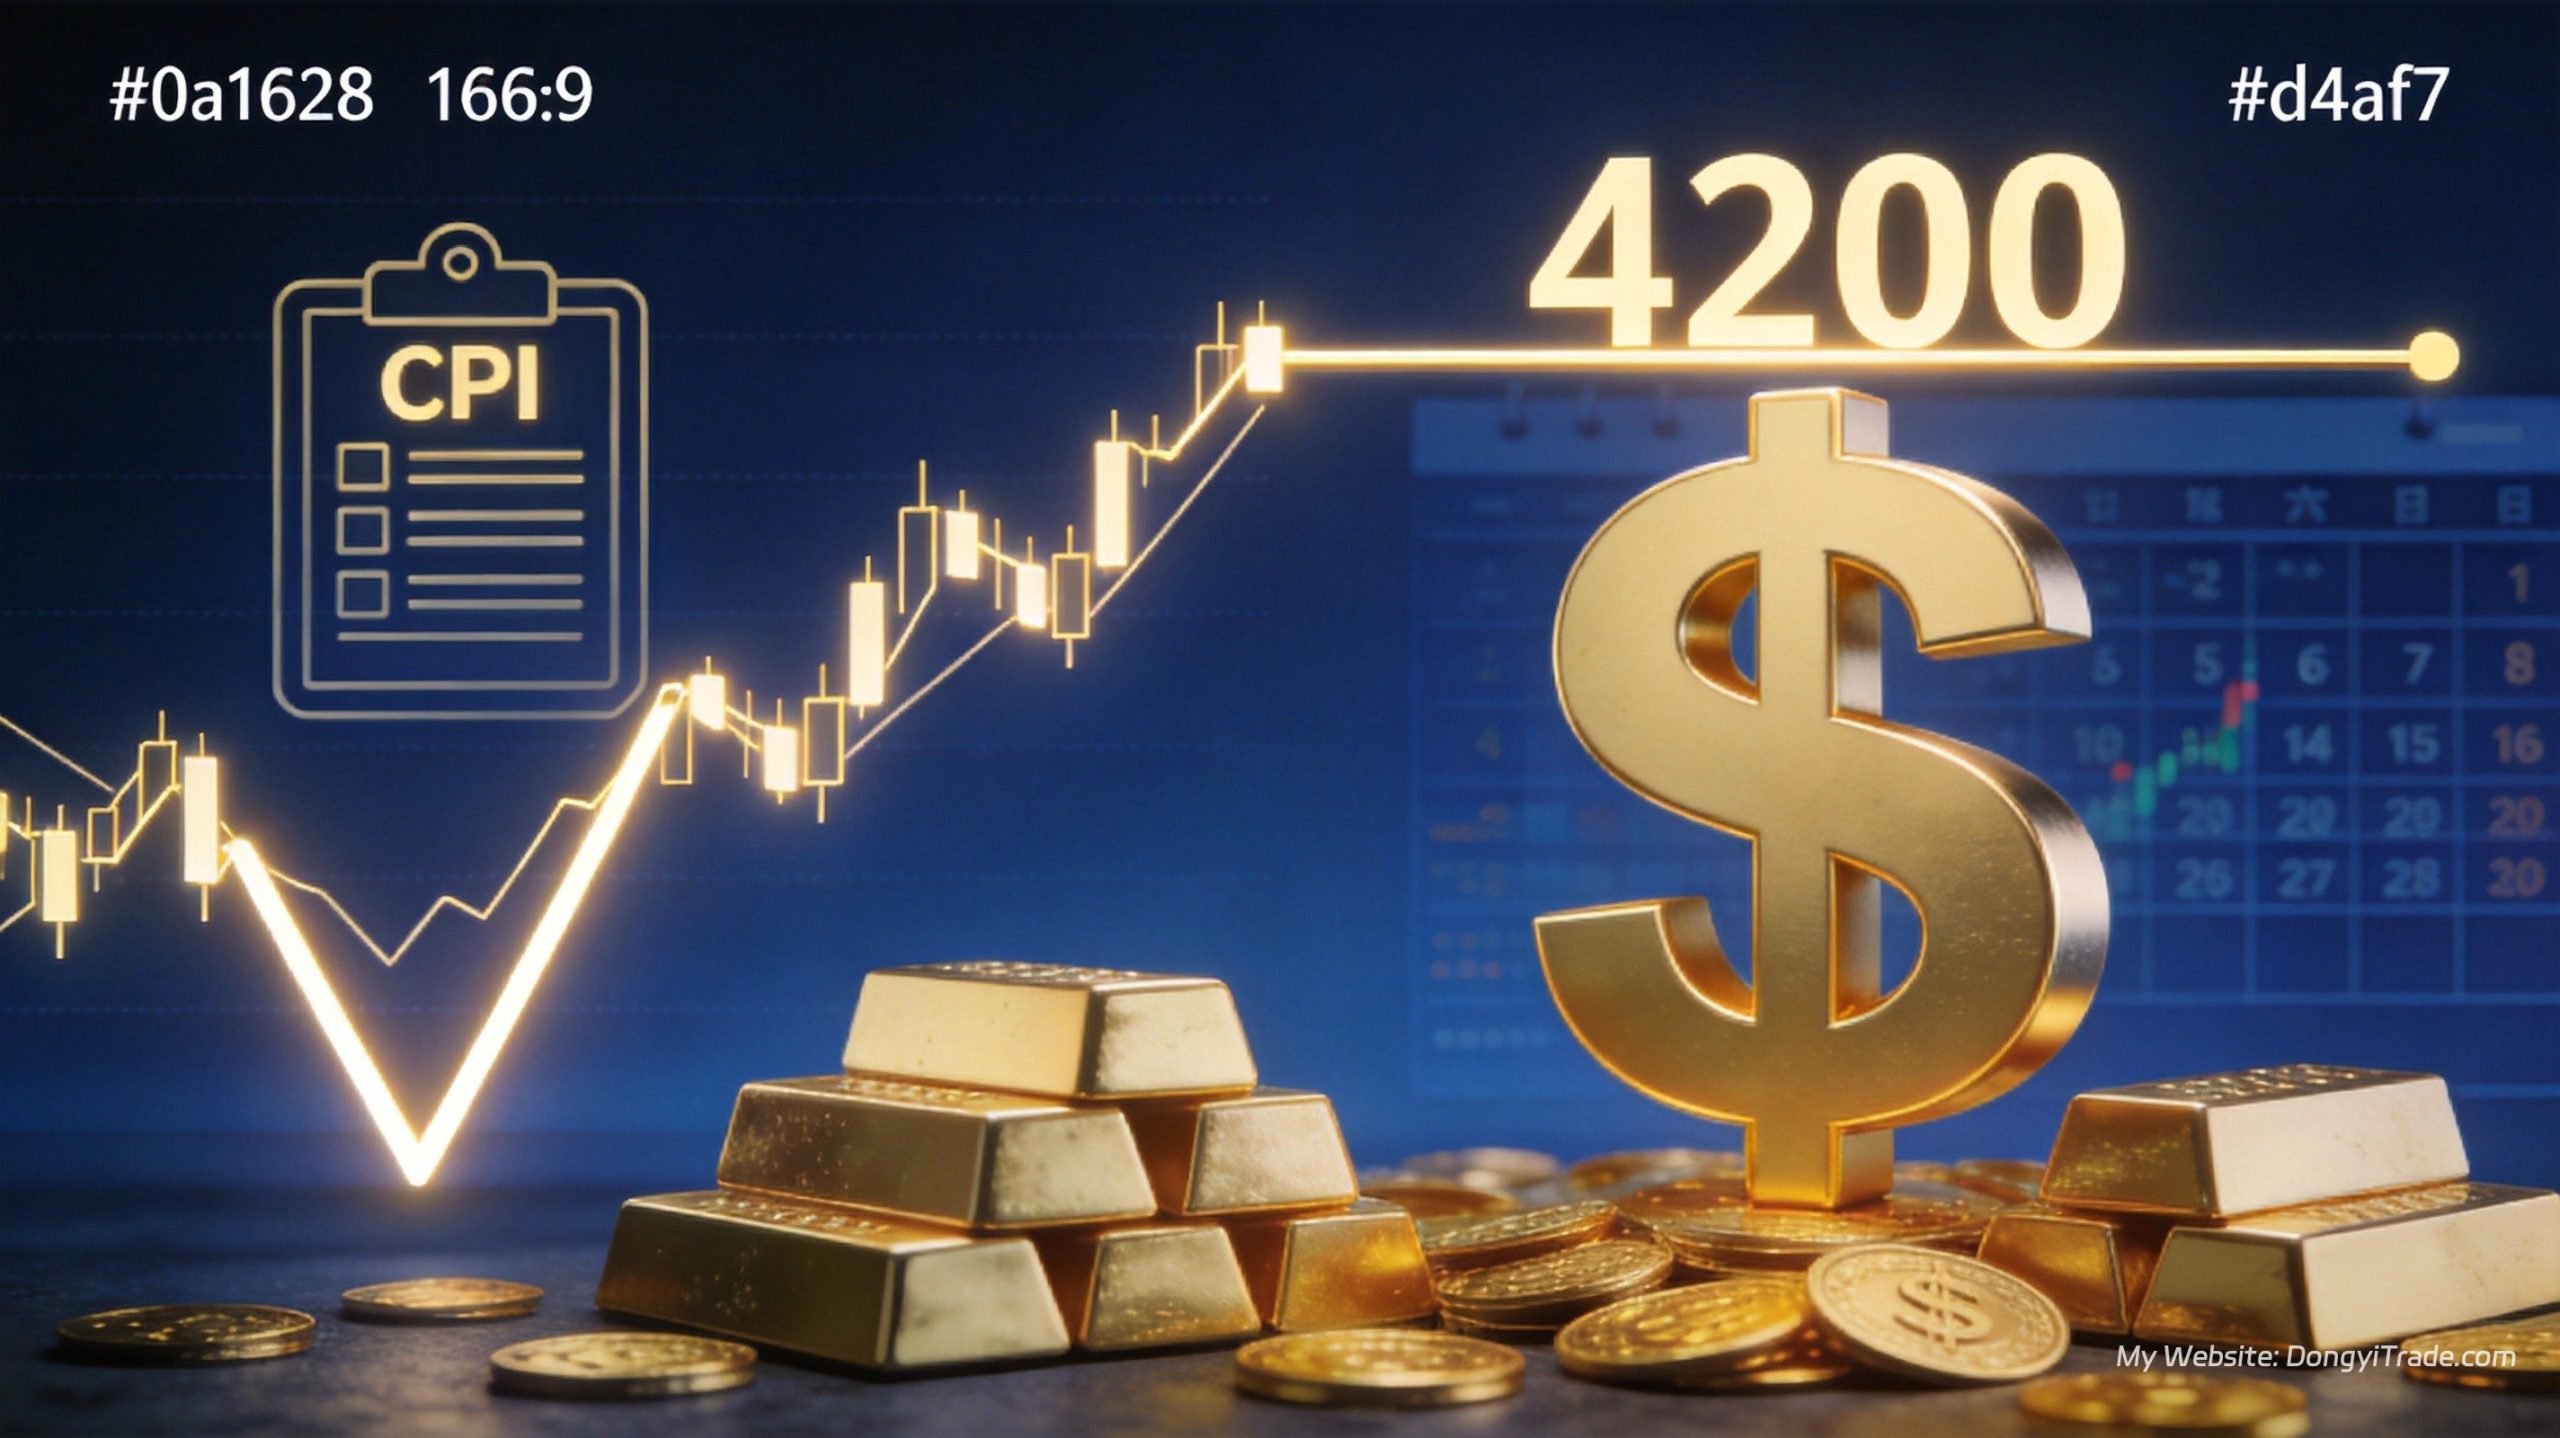
Straight to the point: gold delivered a textbook V-shaped reversal last week — dipping to a two-month low of $4,066.30 on Wednesday (October 7), then ripping back as dip buyers piled in, closing Friday up 1.5% at $4,194.99 for a weekly gain of roughly 1.3%. In early Monday trading (October 12), spot gold pushed through the $4,200 handle to trade near $4,205. But $4,200 is both a psychological level and a technical ceiling — ahead of Wednesday’s CPI print, neither chasing the rally nor catching the dip is the optimal play.
Last Week in Review: Three Drivers Behind the $4,066 Comeback
First, oversold conditions met a key psychological floor. Above $4,000, physical and central bank demand provides a structural bid, and $4,066 landed right on the 78.6% Fibonacci retracement of the prior advance. Technical support and psychological support resonated, triggering a joint short-covering and dip-buying rally.
Second, Treasury yields rolled over. The 10-year yield backed off its two-decade high, falling 3.5 basis points on the week — its largest weekly drop in two months — marginally easing the rate pressure on non-yielding assets.
Third, a weak payrolls report repriced hike expectations. September non-farm payrolls added just 29,000 jobs against roughly 90,000 expected, and CME FedWatch odds of an October rate hike collapsed from 64% to under 20%. The knife hanging over gold has been lifted, at least for now.
Three Key Events This Week: A Data-Dense Calendar Led by CPI
| When | Event | Impact on Gold |
|---|---|---|
| Wednesday (Oct 14) | US September CPI | The week’s biggest variable. Nomura expects core CPI to cool; if confirmed, the urgency of back-to-back hikes fades — bullish for gold. A sticky print could send price back to test the $4,000 psychological level |
| Thursday (Oct 15) | September PPI, retail sales, initial jobless claims | A combined inflation-and-consumption check, released in a cluster that amplifies volatility; beware of stop-run spikes |
| Thursday evening (local time) | Fed Chair Kevin Warsh speaks at an IMF event | The most important policy signal window before the October 27-28 FOMC meeting; any hint on the December path gets priced instantly |
Current market pricing: roughly an 18% chance of an October hike, and an 84% probability of at least one more 25bp hike by year-end. Anything that shifts December expectations — data or speeches — will force a repricing of rate expectations, and gold volatility will expand accordingly.
The Money-Flow Undercurrent: 23 Straight Months of Central Bank Buying, Record ETF Inflows
The flow picture stands in sharp contrast to price action. The People’s Bank of China added roughly 21 tonnes of gold in September, taking holdings to 2,196 tonnes — a 23rd consecutive monthly purchase and the largest single-month buy in three years. Global gold ETFs took in $10 billion in September, capping a record $31 billion third quarter, with total holdings at an all-time high of 4,256 tonnes.
UBS’s latest view: gold may retest support near $4,000 in the short term, but structural dip-buying should build a price floor at that round number. The bank targets $4,600 by December, $5,000 by March 2027. Falling prices alongside rising holdings is the signature of systematic allocation buying — the fundamental reason a 6.5% September correction never broke $4,000.
Technicals: The $4,100 Floor Versus the $4,200 Ceiling
Immediate resistance sits at $4,200-$4,205 (Friday’s rebound high plus the round number), followed by the 100-day SMA near $4,260 and the 50-day SMA near $4,335. On the downside, first support is the 78.6% Fibonacci level at $4,104, then the $4,075-$4,066 zone marking last week’s lows, with $4,000 as the final line of defense.
On sentiment, the latest Wall Street survey shows 50% of analysts bullish on gold this week and only 14% bearish. Yet the dollar index is up for a fourth straight week (at 102.23), and an 84% priced probability of a December hike caps the upside. The market remains in a high-level consolidation between $4,000 and $4,200, awaiting this week’s data for direction.
Trading a Data Week: Three Execution Rules from a Quant’s Playbook
Rule one: cut position size around the CPI release. Spreads and slippage multiply around the print; my model automatically downshifts per-trade risk to 0.5x for the two hours bracketing the release. Event flags can be set in advance using the built-in economic calendar on ECMarkets’ MT5 — don’t rely on memory.
Rule two: use price alerts instead of staring at the screen. Set two-way alerts at $4,100 and $4,260 in your ECMarkets account and reassess only when price gets there, instead of letting intraday noise bait you into early entries. For volatility patterns around data windows, see my complete guide to XAUUSD trading sessions.
Rule three: trade only the post-data confirmation. The first move after CPI is often a fake-out; wait for a 15-minute close to confirm direction before entering. Better to miss the first leg than to be its victim. One more variable to watch: Iran says the US has accepted some of its conditions for reopening the Strait of Hormuz — further de-escalation would drain safe-haven premium, so protect longs with a trailing stop. For the full Q4 macro thesis, revisit the October gold market outlook.
FAQ
When is this week’s CPI released?
US September CPI lands on Wednesday (October 14), with September PPI and retail sales on Thursday (October 15), both during US morning hours. Fed Chair Kevin Warsh speaks at an IMF event on Thursday evening local time — the most important policy signal before the late-October FOMC meeting.
Can gold hold above $4,200?
The $4,200-$4,205 zone is immediate resistance, and a decisive break likely needs help from a friendly CPI print. Confirmation would be a daily close above $4,205 followed by a test of the 100-day SMA at $4,260. Chasing longs at $4,200 before the data offers poor risk-reward.
Will $4,000 break?
Unless CPI comes in hot enough to sharply reprice hike expectations, a near-term break looks unlikely. Central bank purchases and ETF allocation flows provide a systematic bid near $4,000, and UBS expects structural buying to build a floor there. That said, a daily close below $4,066 calls for risk-based deleveraging — not bottom-fishing.
What position size should I use in a data week?
Cut per-trade risk from the standard 1% to 0.25%-0.5%, avoid opening new positions within two hours of the CPI release, and return to normal sizing only after the data confirms a direction. In a data week, job number one is survival; profits come second.
💡 Key Takeaways
- Gold staged a V-shaped rebound from a two-month low of $4,066 last week, closing up 1.3%, and reclaimed the $4,200 handle in early Monday trading.
- This week’s core events: September CPI on Wednesday, PPI and retail sales on Thursday, and a Fed Chair Warsh speech Thursday evening — anything that shifts December hike expectations will amplify volatility.
- Flows diverge from price: 23 straight months of central bank buying and a record $31 billion Q3 for gold ETFs mean allocation money is systematically buying the dip near $4,000.
- Technical picture: the $4,100 floor versus the $4,200 ceiling — only a daily close above $4,205 opens the path to $4,260.
- Data-week execution: downshift risk around CPI, replace screen-watching with two-way price alerts, and trade only the 15-minute confirmation.
About the Author: Dongyi, professional quantitative trader focused on XAUUSD gold trading strategies, running DongyiTrade (dongyitrade.com), sharing quantitative trading strategies and in-depth market analysis.
Contact: WeChat: DongyiTrade | Telegram: @DongyiTrade