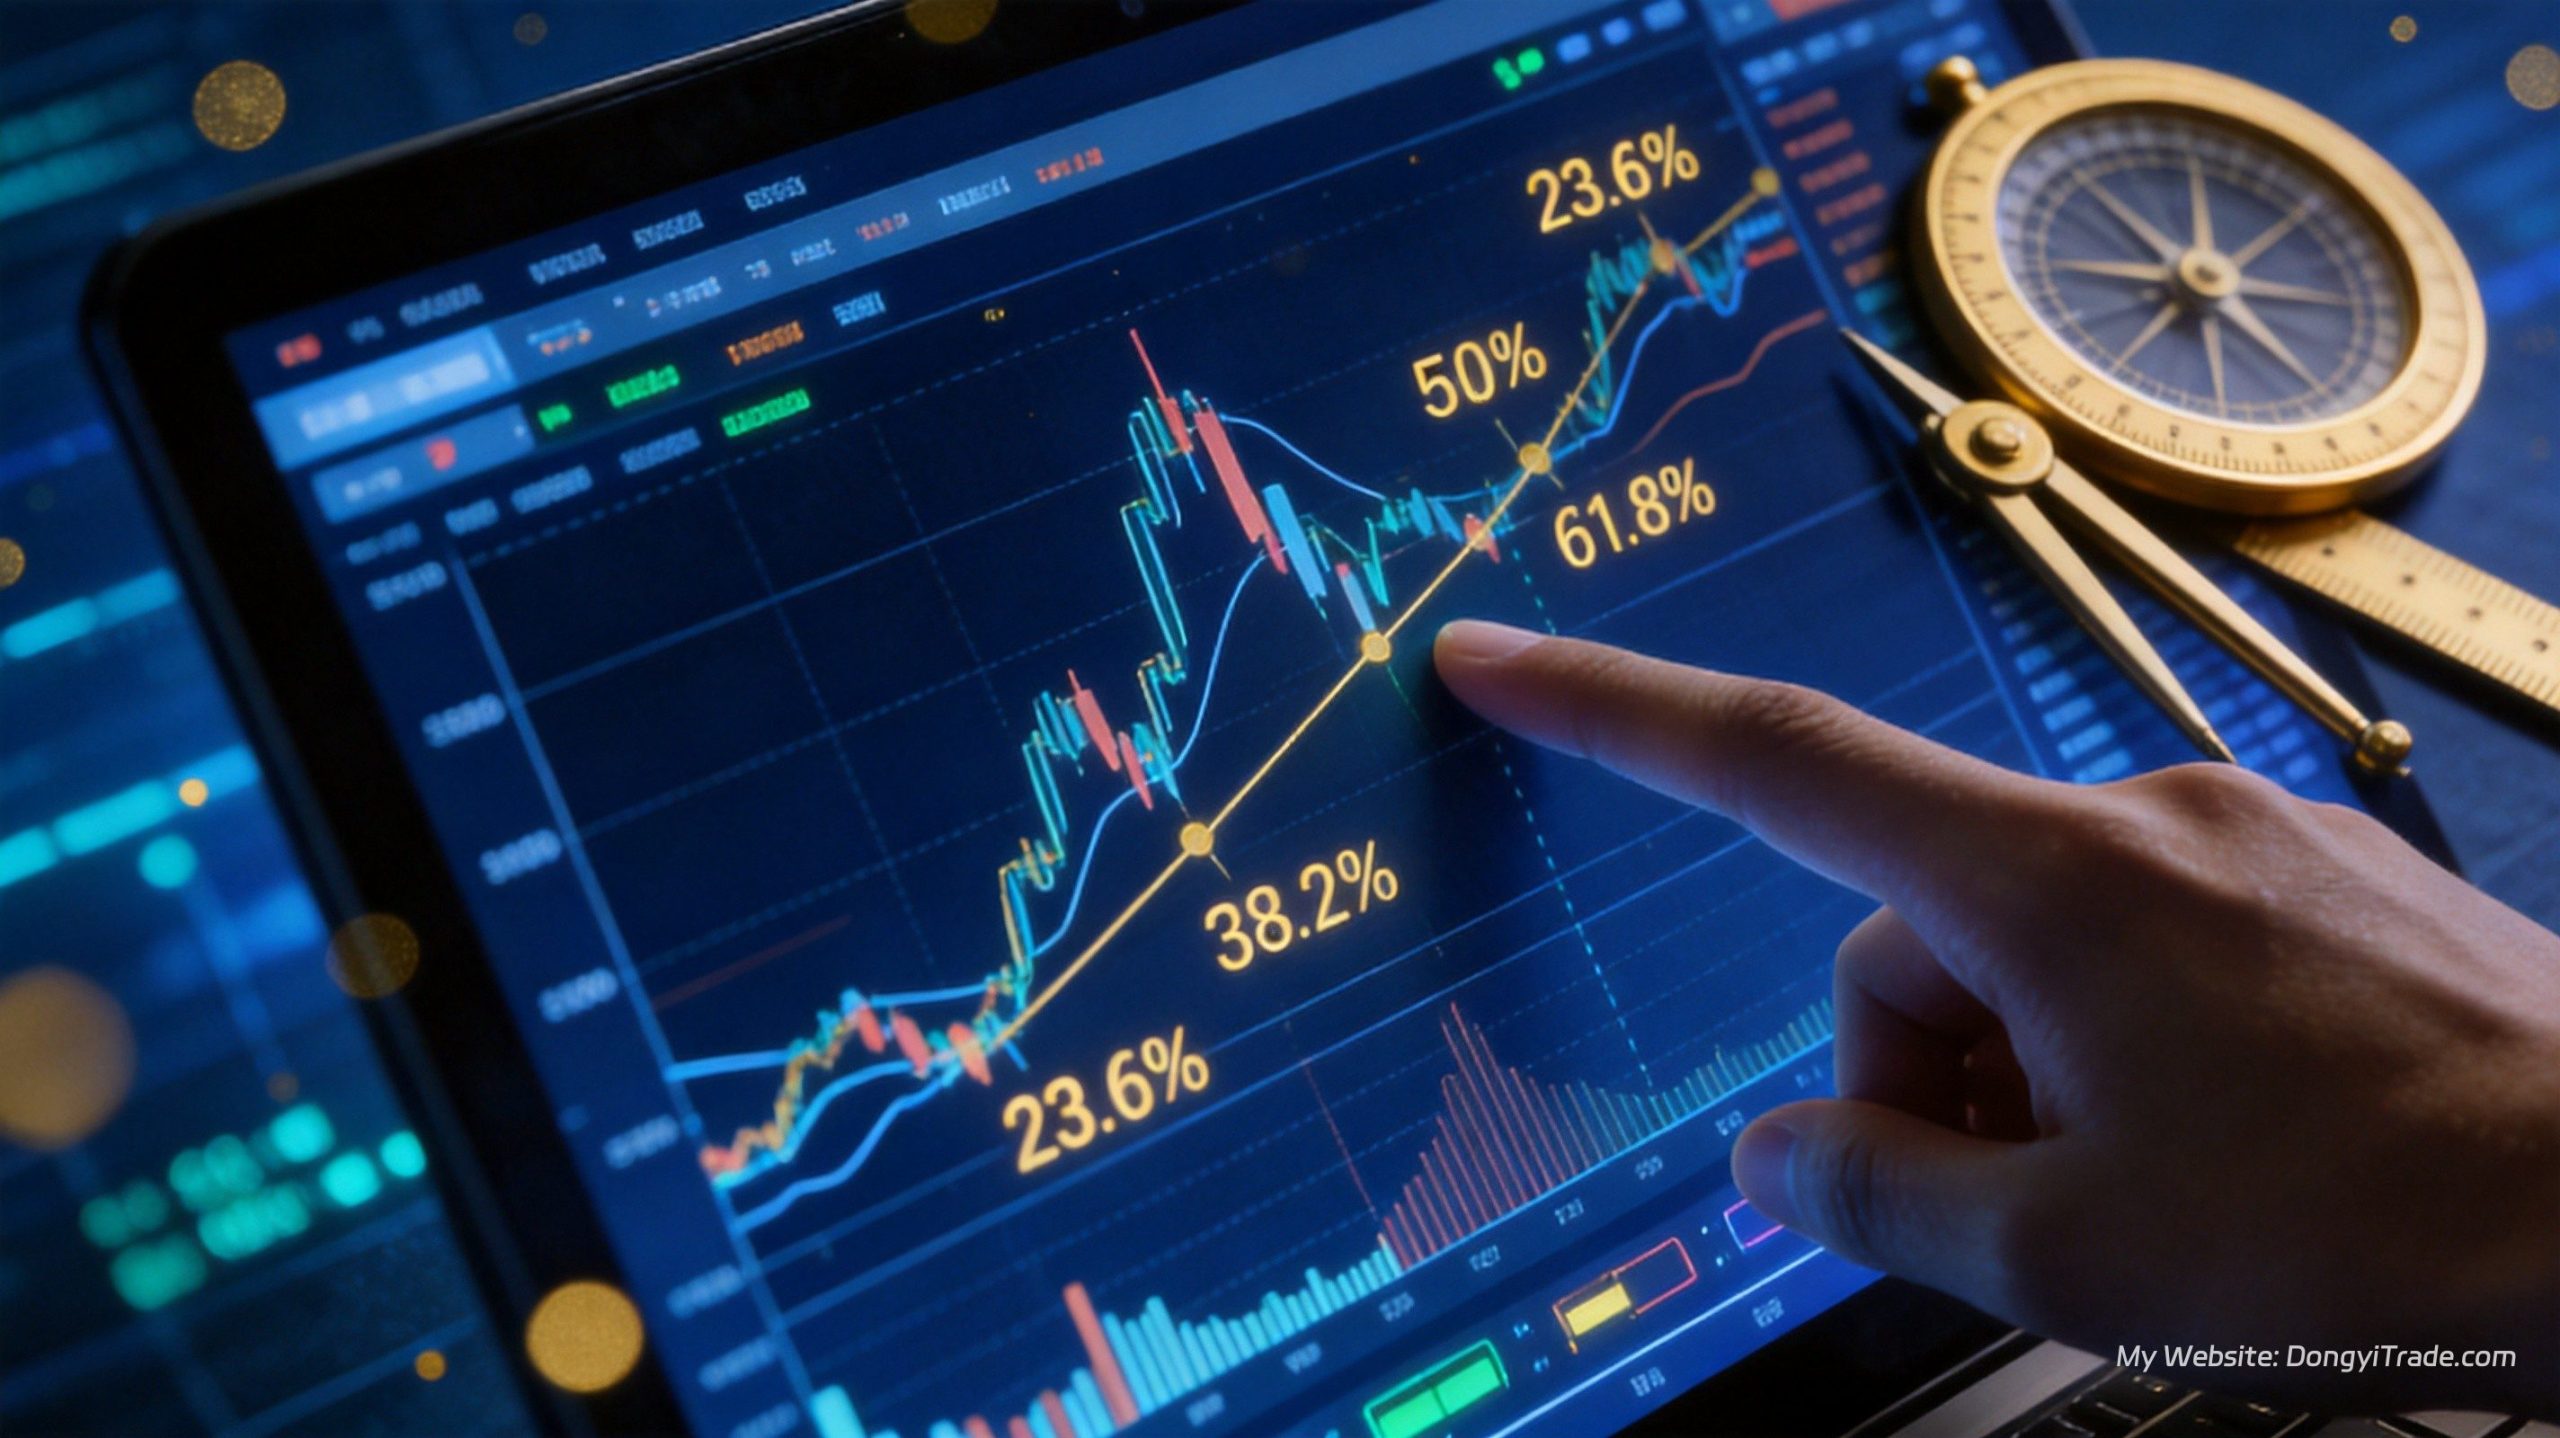
Fibonacci retracement is one of the most iconic tools in technical analysis — a framework built on the golden ratio that helps traders anticipate where pullbacks are likely to end. In XAUUSD gold trading, the 61.8% level is known as the “golden lifeline” among institutional traders. DailyFX’s 2026 research puts the bounce probability at this level at 47.3%, dramatically higher than the ~20% you’d expect from a random support level.
## The Core Logic Behind Fibonacci Retracement
Fibonacci retracement levels are horizontal lines drawn at key golden-ratio percentages of a prior price swing. They help you identify where a pullback is likely to find support or resistance before the trend resumes.
### Where the Golden Ratios Come From
The Fibonacci sequence (0, 1, 1, 2, 3, 5, 8, 13, 21, 34, 55…) has a remarkable mathematical property: divide any number by the one before it and the ratio converges on 1.618 — the golden ratio, or phi (Φ).
| Calculation | Result | Retracement Level |
|————-|——–|——————-|
| 1 – (1/1.618) | 0.382 | 38.2% |
| 1 – (1/2.618) | 0.618 | 61.8% |
| 1 – (1/4.236) | 0.764 | 76.4% (often rounded to 78.6%) |
| Square root of 0.618 | 0.786 | 78.6% |
| 1 ÷ 2 | 0.5 | 50% (psychological, not Fibonacci but universally used) |
| 1 – 0.764 | 0.236 | 23.6% |
These levels work because they’re a self-fulfilling prophecy. When thousands of institutional traders, hedge funds, and bank prop desks are all watching the same 61.8% level and placing orders there, price naturally reacts when it arrives. The tool isn’t magic — it’s a map of where the big players are likely to act.
### The Five Key Retracement Levels, Ranked
| Level | Strength | What It Means | Trading Value |
|——-|———-|—————|—————|
| 23.6% | ⭐⭐ | Shallow pullback — very strong trend | Entry in powerful trends, lower probability |
| 38.2% | ⭐⭐⭐ | Moderate pullback — healthy correction | Common entry point in decent trends |
| 50% | ⭐⭐⭐⭐ | Psychological level — the halfway mark | Very important reference, frequent bounces |
| 61.8% | ⭐⭐⭐⭐⭐ | The golden ratio — strongest level | Your primary trading level, highest win rate |
| 78.6% | ⭐⭐⭐ | Deep pullback — last chance before trend breaks | Final entry opportunity; below it, trend is dead |
DailyFX analyzed 1,247 complete XAUUSD swing moves over 10 years (2016-2026), tracking how often price reached each level and how often it bounced:
| Level | Reach Probability | Bounce After Reach | Overall Effectiveness |
|——-|——————-|——————–|———————-|
| 23.6% | 78.4% | 18.2% | Low |
| 38.2% | 65.1% | 35.6% | Medium |
| 50% | 52.3% | 29.8% | Medium-High |
| 61.8% | 41.7% | 47.3% | Highest |
| 78.6% | 28.9% | 31.5% | Medium |
The 61.8% level clearly has the highest bounce probability at 47.3%. But note that it only gets reached 41.7% of the time — you need patience, because not every pullback gets there.
### Why XAUUSD Gold Responds So Well to Fibonacci
Gold has three characteristics that make Fibonacci particularly effective:
First, **strong trends.** Gold produces multi-week trending moves driven by macro factors — rates, inflation, geopolitics. The clearer the trend, the better Fibonacci levels work. Second, **heavy institutional participation.** Investment banks, hedge funds, and central banks all use Fibonacci tools for position management, turning these levels into consensus support and resistance zones. Third, **sentiment-driven cycles.** As a safe-haven asset, gold’s fear-and-greed cycles align naturally with Fibonacci proportions.
As discussed in the XAUUSD Momentum Trading Strategy Guide, with $15-$30 of average daily range, gold provides more than enough room for Fibonacci-based trades to develop profitably.
## How to Draw Fibonacci Retracement Correctly
Most people struggle with Fibonacci not because the concept is hard, but because they draw it wrong. Pick the wrong swing points and everything downstream is garbage.
### The 3-Step Standard Method
**Step 1: Determine the trend direction.** Is the current move up or down? For an uptrend, you’ll be measuring from swing low to swing high. For a downtrend, from swing high to swing low.
**Step 2: Anchor your starting point.** Begin at the origin of the trend — the absolute low for an uptrend, absolute high for a downtrend. Drag your Fib tool to the opposite end.
**Step 3: Verify swing validity.** Your endpoints should be clear swing extremes — not random wicks. A good test: the point should be the highest high or lowest low for at least 30 bars on your timeframe (30 hours on the H1 chart).
### Common Drawing Mistakes
| Mistake | What It Looks Like | The Damage |
|———|——————-|————|
| Using wicks as swing points | Drawing to long upper/lower shadows | Levels shift, signals misfire |
| Mixing timeframes | Daily swing points for H1 trades | Levels don’t match the scale of your trade |
| Cherry-picking | Drawing only on charts where it “works” | Curve-fit results that fail in real time |
| Drawing backwards | Top-to-bottom in an uptrend | All levels are reversed |
**Pro tip:** start on a higher timeframe (if you trade H1, pull up H4 first), identify the major swing on the higher timeframe, then drop to your trading timeframe for fine-tuning. This ensures you’re working with meaningful swings, not noise.
### Multi-Timeframe Fibonacci Confluence
When Fibonacci levels from different timeframes line up at roughly the same price, you get a confluence zone — and the strength of that level multiplies.
For example: the 50% retracement on the daily chart happens to land almost exactly at the 61.8% level on the 4-hour chart, and there’s also a prior swing high at the 38.2% level on the 1-hour chart. Triple confluence like this can push the bounce probability from 47% up to 65%+.
TradingView’s 2025 community backtests showed that multi-timeframe Fibonacci confluence strategies reach 58-62% win rates on XAUUSD — 10-15 percentage points higher than single-timeframe approaches.
## Strategy #1: The 61.8% Golden Reversal Play
The 61.8% level is the crown jewel of Fibonacci trading — the highest-probability setup in the toolkit.
### Entry Rules (Long Example)
**Four conditions must align:**
1. Price pulls back to the 61.8% Fibonacci level (within ±0.5%)
2. A reversal candlestick pattern forms — bullish engulfing, hammer, morning star
3. RSI is oversold (below 30) or turning up from oversold
4. Volume expands on the reversal candle (confirms buying interest)
**Entry trigger:** Enter on the close of the reversal candle, or on the open of the next candle. Don’t chase — if you miss the entry, wait for the next setup.
**Stop loss:** Place it $1-$2 below the 78.6% retracement level, or alternatively below the swing low of the entire move.
**Take profit targets:** First target at the 38.2% level, second target at the prior high (the 0% level).
### Example Walkthrough with Real Numbers
Let’s walk through a concrete XAUUSD setup:
– Swing low: $2,300
– Swing high: $2,400
– 61.8% retracement: $2,338.20
– 78.6% retracement: $2,321.40
– 38.2% retracement (Target 1): $2,361.80
– Prior high (Target 2): $2,400.00
| Parameter | Price | Distance |
|———–|——-|———-|
| Entry | $2,338 | — |
| Stop Loss | $2,320 (below 78.6%) | $18 |
| Target 1 | $2,362 (38.2%) | $24 |
| Target 2 | $2,400 (prior high) | $62 |
| R:R at T1 | — | 1.33:1 |
| R:R at T2 | — | 3.44:1 |
If you take partial profits at T1 (close half) and let the rest run to T2 with a breakeven stop, your blended reward-to-risk comes out around 2.4:1. At a ~47% win rate, that’s a solid positive expectancy over time.
### Handling Fakeouts
The 61.8% level frequently sees fakeouts — a quick dip below that snaps right back. Three clues it’s a fakeout and not a real breakdown:
1. **Closing price recovery.** If the candle closes back above 61.8% (for longs), it was a shakeout, not a break.
2. **Duration of the break.** The shorter the dip lasts (1-2 candles), the higher the chance it’s a fakeout.
3. **Reversal candle shape.** A hammer or bullish engulfing right after the dip is the classic fakeout reversal signature.
The takeaway: don’t enter the moment price touches the level. Wait for the candle to close and confirm. It’s better to miss a trade than to enter on a false signal. As emphasized in the Copy Trading Risk Management Guide, patience for high-quality setups is the foundation of consistent profits.
## Strategy #2: Fibonacci Extension Targets
Fibonacci isn’t just for entry — you can also use extensions to project where the next leg of the trend is likely to end.
### How Extensions Work
Fibonacci extensions (sometimes called expansions or projections) measure the next swing’s potential length based on the prior swing’s proportions. Common extension levels are 127.2%, 161.8%, 200%, and 261.8%.
| Extension | What It Represents | When to Use It |
|———–|——————-|—————-|
| 127.2% | First conservative target | Weak trends or ranging markets |
| 161.8% | Second target — the workhorse | Normal-strength trends |
| 200% | Third target — psychological level | Strong trends |
| 261.8% | Final target — blowoff area | Exceptional trends |
### Drawing Extensions
You need three points to draw extensions:
1. **Point A:** Origin of the first swing (swing low or high)
2. **Point B:** End of the first swing (swing high or low)
3. **Point C:** End of the retracement (pullback low or high)
Draw the Fib tool from A to B for the impulse wave, then from B to C for the corrective wave. The extensions project forward from point C at ratios of the A-B distance.
### Real XAUUSD Example
Suppose XAUUSD rallies from $2,300 to $2,400 (A to B, a $100 move), pulls back to $2,340 (60% retracement, point C), then starts rallying again. Here are your extension targets:
| Extension Level | Calculation | Target Price |
|—————–|————-|————-|
| 127.2% | $2,340 + ($100 × 0.272) | $2,367.20 |
| 161.8% | $2,340 + ($100 × 0.618) | $2,401.80 |
| 200% | $2,340 + ($100 × 1.0) | $2,440.00 |
| 261.8% | $2,340 + ($100 × 1.618) | $2,501.80 |
The 161.8% extension is the most important target. FXStreet’s 2026 analysis of XAUUSD found that price reaches the 161.8% extension about 38% of the time, and reaches 127.2% about 56% of the time.
## Multi-Factor Confluence System
Fibonacci alone isn’t enough for reliable trading. Combine it with other tools to stack the odds in your favor.
### Fibonacci + RSI: The Classic Combo
This is the most popular pairing for good reason — it works.
| Signal Strength | Fibonacci Level | RSI Condition | Approximate Win Rate |
|—————-|—————-|—————|———————|
| Weak | 38.2% touch | RSI neutral (40-60) | ~32% |
| Moderate | 61.8% touch | RSI near oversold (30-40) | ~48% |
| Strong | 61.8% level | RSI oversold (<30) and turning up | ~58% |
| Very Strong | 61.8% + prior support confluence | RSI oversold + bullish divergence | ~65% |
**Fibonacci + RSI divergence is the elite setup.** When price makes a lower low at the 61.8% level but RSI makes a higher low (bullish divergence), the win rate jumps to 60-65%. As covered in the RSI Complete Guide, divergence at key support levels is far more powerful than either signal alone.
### Fibonacci + Bollinger Bands
When a Fibonacci retracement level lines up with a Bollinger Band, the support or resistance gets noticeably stronger.
The classic setup: price pulls back to the 61.8% Fib level and simultaneously touches the lower Bollinger Band. Two independent support tools agreeing on the same zone — the bounce probability climbs substantially.
Fazen Capital’s 2026 research found that Fibonacci + Bollinger Band double confirmation produces 55.6% win rates on the XAUUSD H1 chart, with an average reward-to-risk of 1.72:1 and annual returns of around 38%.
### Fibonacci + Candlestick Patterns
Candlestick reversal patterns are the cleanest entry confirmation. The most effective pairings:
– **61.8% + Bullish Engulfing:** The strongest reversal combo, ~58% win rate
– **61.8% + Hammer:** Bottom confirmation, ~54% win rate
– **61.8% + Morning Star:** 3-candle reversal pattern, ~62% win rate
– **61.8% + Double Bottom (Two Pins):** Twice-tested support, ~56% win rate
The value of candlestick confirmation is simple: it tells you “the reversal has started,” not just “it might start.”
## Risk Management and Position Sizing
No strategy works without proper risk management. Here are the Fib-specific rules.
### Stop Loss Placement
| Entry Level | Stop Placement | Stop Distance (H1 XAUUSD) |
|————|—————|—————————|
| Long at 61.8% | Below 78.6% by $2-$3 | ~$15-20 |
| Long at 38.2% | Below 50% by $2-$3 | ~$12-15 |
| Long at 50% | Below 61.8% by $2-$3 | ~$12-18 |
**The rule: your stop must be beyond the next Fibonacci level down.** If you enter at 61.8%, the stop goes below 78.6%. If price breaks all the way through 78.6%, the trend is broken and there’s no reason to stay in the trade.
### Position Size Calculation
Calculate your lot size based on your stop distance and risk tolerance:
> Lot Size = Account × Risk Per Trade % ÷ (Stop Distance in Points × Point Value)
For XAUUSD, each 0.1 dollar move (10 points) is worth $1 per standard lot. Example:
– Account: $10,000
– Risk per trade: 1% = $100
– Stop distance: $18 = 180 points (1 point = $0.10)
– Point value per lot: $1 per point per standard lot
– Position = $100 ÷ (180 × $1) = 0.55 lots
Round to 0.5 lots to stay within your 1% risk budget.
### Scaling In and Scaling Out
To improve your win rate and smooth your equity curve, use phased entries and exits:
**Scaled entry:** Put on half your position at the 61.8% level. If price dips to 78.6% and shows confirmation, add the other half. This gives you a better average entry cost, though you must ensure total risk stays within your per-trade budget.
**Scaled exit:** Take half profits at the 38.2% level (lock in some gains), move the stop on the remaining position to breakeven, then let the rest run to the prior high or 161.8% extension.
Backtesting shows that phased trading slightly reduces your maximum win per trade but significantly improves win rate and curve smoothness — the net long-term result is actually higher.
## Common Mistakes and How to Avoid Them
### The 5 Most Common Fibonacci Mistakes
| Mistake | What Traders Do | The Outcome | How to Fix It |
|———|—————-|————-|—————|
| Over-drawing | Fib lines all over the chart | Information overload, analysis paralysis | Draw only 1-2 major swings per timeframe |
| Set-it-and-forget-it | Never redraw after new swings | Stale levels, missed signals | Redraw after every significant new swing |
| Trading every touch | Entering on every Fib touch | Too many losing trades | Wait for at least 2 confirming factors |
| Tight stops | Stop too close to entry | Getting stopped out by noise | Stop must be beyond the next Fib level |
| Counter-trend entries | Buying Fib support in a downtrend | Low win rate, big losses | Only trade Fib levels in the trend direction |
### The #1 Rule You Must Remember
**Never trade Fibonacci retracements against the major trend.**
In a downtrend, don’t go long just because price hit a 61.8% Fib level. In downtrends, that 61.8% level is more likely to be a pause before the next leg lower. The correct play in a downtrend: wait for rallies into Fib resistance (like 38.2% or 50%) and look for short entries.
Trading Fibonacci with the trend, not against it, is the single biggest improvement most traders can make. The Journal of Technical Analysis’s 2024 study found that trend-aligned Fibonacci strategies outperform counter-trend ones by 22 percentage points in win rate.
FAQ
What is Fibonacci retracement and how do you use it in XAUUSD trading?
Fibonacci retracement is a technical analysis tool based on golden ratio mathematics. By connecting the high and low of a trend swing, you generate key retracement levels: 23.6%, 38.2%, 50%, 61.8%, and 78.6%. These levels predict where price is likely to find support or resistance during a pullback. In XAUUSD trading, the 61.8% level is the strongest. The basic play: buy pullbacks to Fibonacci support in an uptrend, sell rallies to Fibonacci resistance in a downtrend.
Which Fibonacci retracement level works best for XAUUSD?
The 61.8% level — the “golden ratio” — is by far the most effective. DailyFX’s 2026 study of 10 years of XAUUSD data found that price bounces from the 61.8% level 47.3% of the time it’s reached. The 38.2% level comes in second at 35.6%, followed by 50% at 29.8% and 23.6% at 18.2%. Always confirm with other indicators before entering — a bounce alone isn’t a trade signal.
How do you draw Fibonacci retracement correctly? How do you pick swing points?
Three steps: identify a complete trend swing, connect the start and end points with your Fibonacci tool, and the levels auto-generate. Pick obvious swing highs and lows — not intraday wicks. Match the swing to your timeframe. And draw in the direction of the trend: bottom-to-top for uptrends, top-to-bottom for downtrends. Most people get bad Fibonacci results because they pick arbitrary points.
What indicators work best with Fibonacci retracement?
Four standout combinations: (1) RSI — confirming oversold at the 61.8% level creates the highest-quality signals; (2) Candlestick patterns — engulfing bars, hammers, and dojis confirm reversal intent; (3) Bollinger Bands — when a Fib level aligns with a Bollinger Band, confluence boosts success rate by roughly 25%; (4) Volume — confirming buying or selling pressure at the level. TradingView’s 2025 data shows Fib + candlestick + RSI triple confirmation reaches 58-62% win rates on XAUUSD.
Where should you set your stop loss when trading Fibonacci retracements?
For a long entered at a Fib support, place your stop below the next Fibonacci level down. If you enter at 61.8%, put your stop below 78.6% — or 1-2 ATR below the swing low. On XAUUSD H1, that’s typically $15-$20 of risk for a 61.8% entry. Don’t set it too tight (you’ll get stopped out by noise) or too wide (reward-to-risk suffers). Always aim for at least 1.5:1 R:R, ideally 2:1 or better.
—
🎯 Join My XAUUSD Live Copy Trading
Conservative XAUUSD quantitative strategy: Bollinger Bands mean reversion + momentum trend filter
2026 live performance: 47.3% annualized, 18.6% max drawdown
Open an ECMarkets account via our exclusive link and get 30% trading rebate. Minimum deposit $1,000 to start copying.
Open Account & Copy · 30% Rebate
Referral Code: 793EN | Telegram: @DongyiTrade