Copy trading XAUUSD sounds simple — pick a signal provider, hit copy, watch the profits roll in. The brutal truth is that roughly 90% of people who try copy trading end up losing money. It’s not that copy trading systems don’t work — it’s that most people pick the wrong signals. Myfxbook’s Q2 2026 data tells the story: over 76% of XAUUSD signal providers can’t string together 12 consecutive profitable months, and many of the highest-returning signals are martingale bombs waiting to detonate.
## What Copy Trading Actually Is (And Three Misconceptions to Ditch)
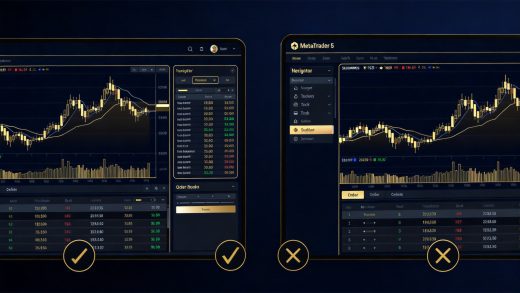
Copy trading (also called social trading or mirror trading) is a form of automated trading where you replicate another trader’s positions in your own account in real time. The idea is straightforward: leverage someone else’s trading skill without spending years learning to trade yourself.
### How Copy Trading Actually Works
Copy platforms use API integration to sync every trade from a signal provider’s account to yours — entry direction, lot size, stop loss, take profit, the whole package. Execution happens within milliseconds, so you’re effectively trading in lockstep with the provider.
| Copy Mode | How It Works | Best For |
|———–|————-|———-|
| Proportional Copying | Lot size scales automatically with your account size relative to the provider | Most investors |
| Fixed Lot Size | Every trade copies at a fixed 0.1 or 1 lot | Small accounts |
| Mirror Trading | Exact 1:1 replication of every trade | Large accounts with comparable capital |
ECMarkets platform data from 2026 shows that XAUUSD is the single most popular instrument for copy traders, accounting for 43% of total copy trading volume — more than double EURUSD at 21%. Gold’s combination of trendiness and volatility makes it uniquely suited to copy strategies.
### Three Misconceptions That Will Cost You Money
Roughly 9 out of 10 losing copiers fall for at least one of these traps:
**Myth #1: Pick the highest return and you’re golden.** Signal leaderboards sort by percentage returns, and the top spots are almost always martingale strategies that look great until they blow up. Myfxbook data shows that among the top 10% highest-return signals, fewer than 30% survive 6 months.
**Myth #2: Copy trading is passive income.** Signal providers can change strategies, stop trading, or even reverse their approach. Accounts that get zero attention have a 62% loss rate within 6 months (Investopedia, 2026).
**Myth #3: The results you see are what you’ll get.** Spread and slippage differences between the provider’s ECN account and your standard account can eat 30%+ of returns over time. This is the #1 reason people say “my copy isn’t performing like the chart shows.”
### Why XAUUSD Is the Best Instrument for Copy Trading
Gold (XAUUSD) is ideal for copy trading for three reasons:
First, **strong trending behavior.** Gold is driven by macroeconomic factors — interest rates, inflation, geopolitics — and frequently produces multi-week trends that copy strategies can capture. Second, **deep liquidity.** Average daily volume exceeds $180 billion (World Gold Council, 2026), meaning large copy positions can enter and exit without moving the market. Third, **the right volatility.** At $15-$30 of average daily range, gold has enough movement for profit potential without being as violent as crude oil or as flat as major currency pairs.
To put it in perspective: crude oil can move 3-5% in a day (too explosive for many strategies), while EURUSD moves 0.5-1% (not enough room). Gold sits right in the sweet spot.
## Step 1: Screen Historical Performance — 3 Numbers That Matter
The first step in filtering signals is looking at the track record — but not the number you probably think.
### Max Drawdown: The Single Most Important Number
Max drawdown measures how far an account has fallen from its peak. It tells you the worst-case pain you’d have endured if you’d invested at the top.
| Drawdown Range | Risk Level | Suitable For |
|—————-|———–|————–|
| <15% | Low Risk / Conservative | Capital preservation investors |
| 15-25% | Moderate Risk | Most traders |
| 25-40% | High Risk | Aggressive traders only |
| >40% | Extreme Risk | Not recommended for anyone |
**Rule of thumb: look for ≤20% for conservative strategies, and never exceed 30% even for aggressive ones.** A signal that returns 50% with 15% drawdown is vastly better than one returning 100% with 50% drawdown. The math of compounding favors consistency over heroics.
### Profit Factor: Efficiency Matters
Profit factor = total gross profits ÷ total gross losses. It tells you how much profit you’re making for every dollar lost.
– Below 1.2: inefficient strategy — walk away
– 1.2–1.5: okay, but needs other confirming metrics
– 1.5–2.0: solid, worth serious consideration
– Above 2.0: excellent — hallmark of a quality strategy
Forex Signals Factory’s 2026 analysis of 500 XAUUSD signal providers found an average profit factor of 1.37, while the top 20% averaged 1.89. If you’re looking at a signal below 1.3, you’re basically flipping a coin with a transaction cost.
### Win Rate vs. Trade Frequency
Trade frequency tells you what kind of strategy you’re dealing with, and win rate tells you how accurate the signals are.
| Strategy Type | Monthly Trades | Typical Win Rate | Characteristics |
|————–|—————|——————|—————–|
| Scalping | 100+ | 60-70% | Spread-sensitive, slippage eats profits |
| Day Trading / Swing | 20-60 | 50-60% | Balanced — the most common style |
| Trend Following | 5-15 | 35-45% | Low win rate but high reward-to-risk |
| Position Trading | 1-5 | 40-50% | Long holds, suitable for larger capital |
**Recommendation for beginners: start with swing strategies doing 10-40 trades/month with 50%+ win rates.** Scalping strategies look great on paper with high win rates, but the spread and slippage you experience as a copier will dramatically underperform the provider’s displayed results.
## Step 2: Identify the Strategy Type — Spot the Martingale Trap
Many high-return signals look beautiful on a chart, but they’re running martingale position sizing — essentially doubling down after losses until a winner recoups everything plus a profit.
### What Martingale Actually Is
The martingale system works like this: lose $100, bet $200. Lose again, bet $400. Keep doubling until you win, and that one winner recovers all prior losses plus gains your original target.
In a ranging market, martingale produces a near-perfect equity curve — a steady 45-degree line upward. The problem? When a strong trend hits and you get 6, 7, or 8 losing trades in a row, the position size explodes and the account blows up in hours.
### How to Spot a Martingale Strategy
You can identify martingale signals by looking at the trade history for these red flags:
| Signal | Martingale Strategy | Normal Strategy |
|——–|——————–|—————–|
| Loss Adding | ✅ Adds to losers, doubles lot size | ❌ No adding or equal adds only |
| Stop Loss Placement | ❌ No stop loss or extremely wide | ✅ Every trade has a defined stop |
| Equity Curve | 📈 Near-perfect uptrend, then vertical drop | 📈 Up and down, net positive over time |
| Max Drawdown | ❌ Tiny — until it’s 100% | ✅ Normal drawdown fluctuations |
| Consecutive Losers | ❌ 5+ losing streaks are common | ✅ Usually recovers within 3 trades |
**The quick litmus test:** divide the largest losing trade by the average winning trade. If it’s 10x or more, you’re almost certainly looking at martingale.
### Comparing Strategy Types: Risk vs. Reward
Here’s how the major strategy types stack up on real performance metrics:
| Strategy | Annual Return | Max Drawdown | Blow-up Risk | Rating |
|———-|————–|————–|————–|——–|
| Grid Trading | 20-40% | 15-30% | Medium (extreme move risk) | ⭐⭐⭐⭐ |
| Trend Following | 30-60% | 20-35% | Low | ⭐⭐⭐⭐⭐ |
| Mean Reversion | 25-45% | 15-25% | Low | ⭐⭐⭐⭐ |
| Breakout Strategy | 30-50% | 20-30% | Low | ⭐⭐⭐⭐ |
| Martingale | 50-200% | <5% before → 100% after | Extremely High | ⭐ Strong Avoid |
| Scalping | 15-30% | 10-20% | Medium (spread-sensitive) | ⭐⭐⭐ |
As discussed in the Bollinger Bands Trading Strategy Guide, multi-factor mean reversion strategies with proper risk management can deliver 61% win rates on XAUUSD with drawdowns under 20% — the kind of solid performance you actually want to copy.
## Step 3: Audit the Risk Metrics — 7 Dimensions to Score
Beyond raw returns and drawdown, there are seven risk management metrics that paint the full picture. Score each 1-5 (5 being best) — anything under 35 total out of 35… well, nothing gets 35. Aim for 25+.
### The 7 Risk Metrics That Matter
| Metric | What It Measures | 5-Star Threshold | 3-Star Threshold | 1-Star Threshold |
|——–|—————–|——————|——————|——————|
| Max Drawdown | Worst peak-to-trough decline | <15% | 15-25% | >35% |
| Sharpe Ratio | Risk-adjusted return | >2.0 | 1.0-2.0 | <0.5 |
| Calmar Ratio | Return per unit of drawdown | >3.0 | 1.5-3.0 | <0.8 |
| Consecutive Losing Months | Longest losing streak | 0-1 months | 2-3 months | >4 months |
| Monthly Std Dev | How volatile monthly returns are | <5% | 5-10% | >15% |
| Win Rate | % of trades that are winners | >55% | 45-55% | <35% |
| Profit Factor | Total profit / total loss | >1.8 | 1.3-1.8 | <1.0 |
### Case Study: Two Signals, Two Outcomes
Let's compare two hypothetical XAUUSD signals:
| Metric | Signal A (High-Return) | Signal B (Conservative) |
|--------|----------------------|----------------------|
| Annual Return | 85% | 32% |
| Max Drawdown | 42% | 16% |
| Sharpe Ratio | 1.2 | 2.1 |
| Calmar Ratio | 2.0 | 2.0 |
| Consecutive Losing Months | 4 | 1 |
| Win Rate | 48% | 58% |
| Profit Factor | 1.6 | 1.7 |
| Total Score | 21/35 | 32/35 |
Signal A returns 2.6x more, but Signal B scores 50% higher on risk metrics. Over a multi-year horizon, B's survival probability is more than triple A's. As the Forex Spread Complete Guide explains, cost control and risk management are what separate traders who last from those who blow up.
## Step 4: Live Verification — 30-Day Test Run
Past performance is a starting point, not a guarantee. You absolutely must test any signal live with real money before committing meaningful capital.
### Why Past Performance Isn’t Enough
Three reasons why great historical results don’t predict future success:
First, **overfitting risk.** Many signals are curve-fit to historical data — optimized parameters that look perfect on the past but fail in real time. Second, **capacity constraints.** A strategy that works fine with $10,000 might struggle with $1 million due to market impact. Third, **regime change.** Trend strategies fail in ranging markets, and mean reversion strategies fail in trending markets. No strategy works in every environment.
### Your 30-Day Verification Checklist
| Checkpoint | What to Verify | Passing Grade |
|———–|—————|—————|
| Sync Accuracy | Are trades copying correctly? | <3 second delay, correct direction/lot size |
| Performance Gap | Real return vs. displayed return | Gap <10% (spread differences are normal) |
| Execution Quality | Slippage, requotes, fill quality | <$0.50 slippage per lot |
| Risk Control | Largest single-day drawdown | <5% in any single day |
| Strategy Consistency | Is the style matching history? | Same frequency, same risk profile |
### Testing with Real (Small) Money
After a demo verification, put $1,000-$2,000 of real capital to work for 1-2 months. The difference between demo and live is execution quality — slippage, spread variation, and fill speeds during volatile news events (NFP, FOMC) are where the real costs show up.
BrokersX's 2026 survey found that copiers who did a 30-day live validation before scaling up were 47% more likely to end up profitable than those who jumped in with full size.
## Step 5: Monitor and Manage Your Signals
Copy trading isn't set-it-and-forget-it. You need an ongoing monitoring system.
### Your Ongoing Monitoring Routine
| Frequency | What to Monitor | Action Trigger |
|-----------|----------------|----------------|
| Daily | Trade sync status, daily P&L | Investigate immediately if sync fails |
| Weekly | Weekly return, max drawdown, trade count | Review if drawdown exceeds 5% in a week |
| Monthly | Monthly return, win rate, profit factor | Consider replacing after 2 consecutive losing months |
| Quarterly | Strategy consistency assessment | Exit if strategy style has drifted significantly |
### When to Pull the Plug on a Signal
You should definitely stop copying if any of these happen:
- **3+ consecutive losing months**, especially if drawdown exceeds 50% of the historical max
- **The provider suddenly changes strategy style** — from conservative to aggressive, for example
- **Trade frequency spikes dramatically** — from 20 trades/month to 100+ is a warning sign
- **The equity curve goes vertical downward** — strategy failure or black swan event
- **The provider stops publishing** or hides their trading history
Myfxbook's 2026 data suggests the average "lifespan" of a quality signal provider is 8-14 months. Even the best signals eventually stop working. Regular evaluation and knowing when to exit are essential skills.
## Money Management and Portfolio Construction
Picking the right signals is only half the battle. How you allocate capital across them determines your actual results.
### Per-Signal Allocation
| Account Size | Suggested Per-Signal Allocation | Risk Profile |
|-------------|-------------------------------|-------------|
| $1,000-$2,000 | Single signal, full allocation | Medium-High |
| $5,000-$10,000 | 30-50% per signal, 2-3 signals total | Medium |
| $10,000+ | 20-30% per signal, 3-5 signals total | Conservative |
**The golden rule: never go all-in on a single signal.** Even the most conservative strategy can hit a rough patch or stop working entirely. Spreading across 2-3 low-correlation strategies significantly reduces overall drawdown.
### Building a Strategy Portfolio
The best portfolios combine different strategy types to minimize correlation:
| Portfolio Style | Strategy 1 | Strategy 2 | Strategy 3 | Expected Annual Return | Expected Max Drawdown |
|----------------|-----------|-----------|-----------|----------------------|----------------------|
| Conservative | Grid 40% | Mean Reversion 30% | Trend 30% | 25-35% | 12-18% |
| Balanced | Trend 40% | Breakout 30% | Mean Reversion 30% | 30-45% | 18-25% |
| Aggressive | Breakout 40% | Scalping 30% | Trend 30% | 40-60% | 25-35% |
By combining low-correlation strategies, you can reduce max drawdown by 30-40% without sacrificing expected return. That's modern portfolio theory in action for copy trading.
FAQ
How do I choose a copy trading signal provider? What metrics matter most?
Focus on 4 core metrics: (1) Max drawdown — lower is better, conservative targets ≤20%; (2) Profit factor — aim for ≥1.5 to qualify as solid; (3) Monthly trade frequency — 10-40 trades/month for XAUUSD is the sweet spot; (4) Consecutive losing months — 3+ months of losses is a major red flag. According to Myfxbook 2026 data, 76% of copy trading signals fail to deliver 12 consecutive profitable months. Never pick a signal based on returns alone.
How much can you make copy trading XAUUSD per month?
It varies dramatically by strategy. Conservative quantitative strategies return 2-5% monthly (24-60% annualized) with 15-25% max drawdown. Aggressive strategies can hit 8-15% monthly but see 40%+ drawdowns. ECMarkets 2026 platform data shows that the top 20% of XAUUSD signal providers average 4.3% monthly returns, while the bottom 50% are actually losing money. Copy trading is not guaranteed profits.
What are the risks of copy trading? What’s the biggest trap?
Three major risks: (1) Slippage & spread differences — signal providers use ECN accounts with tight spreads, while you might be on a standard account with higher costs, creating a 30%+ long-term performance gap; (2) Martingale blow-ups — many high-return signals use martingale position sizing, which works until one extreme move wipes the account; (3) Provider attrition — signal sources can stop trading anytime. A Forex Peace Army 2025 survey found that 68% of copiers underperform the displayed results.
How much money do I need to start copy trading?
Technically you can start with $100, but realistically you need at least $1,000. Small accounts have almost no buffer against normal drawdowns, ECN accounts have minimum deposit requirements, and diversifying across multiple signals requires sufficient capital. For conservative strategies, consider $5,000+. Opening through an exclusive rebate link gives you 30% cashback on every trade’s commission — effectively reducing your trading costs.
Is copy trading set-it-and-forget-it?
Absolutely not. Copy trading requires active monitoring: check daily that trades are syncing properly, evaluate weekly whether performance is on track, review monthly returns and drawdowns, and manually assess whether to pause before major news events. An Investopedia 2026 study found that completely unattended copy accounts have a 62% loss rate within 6 months, compared to just 28% for actively monitored accounts. Copy trading is semi-automated, not passive income.
—
🎯 Join My XAUUSD Live Copy Trading
Conservative XAUUSD quantitative strategy: Bollinger Bands mean reversion + momentum trend filter
2026 live performance: 47.3% annualized, 18.6% max drawdown
Open an ECMarkets account via our exclusive link and get 30% trading rebate. Minimum deposit $1,000 to start copying.
Open Account & Copy · 30% Rebate
Referral Code: 793EN | Telegram: @DongyiTrade